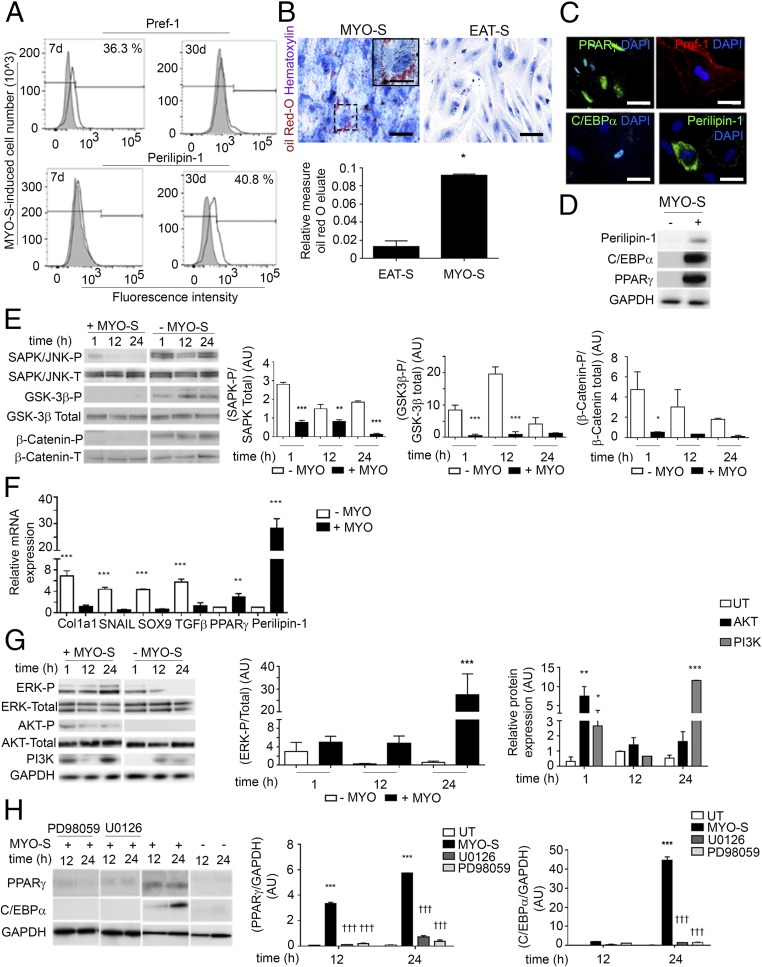
Fig. 4.
The secretome of human atria is a potent inducer of EMT and adipogenic differentiation of epicardial cells. (A) Flow cytometry analysis for Pref-1 and Perilipin in aEPDCs treated with MYO-S for 7 or 30 d (n = 10). (B) Representative images of aEPDCs incubated with MYO-S or EAT-S stained with Oil Red O and counterstained with hematoxylin (n = 10). (Scale bars: 20 µm; Inset 5 µm.) The histogram represents the relative level of Oil Red O staining in treated vs. untreated cells. Data are expressed as the mean ± SEM of independent experiments. *P < 0.05, one-way ANOVA and Bonferroni’s post hoc test. (C) Immunostaining for PPARγ, Pref-1, C/EBPα, and Perilipin-1 of aEPDCs treated with MYO-S (n = 10). (Scale bars, 10 µm.) (D) Immunoblot analysis of Perilipin-1, C/EBPα, and PPARγ in aEPDCs treated with MYO-S for 21 d (n = 3). (E and G) Immunoblots and relative quantification of SAPK/JNK, GSK-3β, and β-catenin (E) and ERK1/2, AKT, and PI3K (G) signaling pathways in aEPDCs treated with MYO-S for 1, 12, or 24 h compared with untreated cells (n = 3). Data are expressed as the mean ± SEM of three independent experiments. *P < 0.05, **P < 0.01, ***P < 0.001, one-way ANOVA and Bonferroni’s post hoc test. (F) qPCR analysis for Col1a1, SNAIL, SOX9, TGFβ, PPARγ, and Perilipin-1 in aEPDCs treated with MYO-S (n = 5). Data are presented as the fold change relative to untreated aEPDCs and are expressed as the mean ± SEM of independent experiments. **P < 0.01, ***P < 0.001, one-way ANOVA and Bonferroni’s post hoc test. (H) Immunoblots and relative quantification for PPARγ and C/EBPα expression in aEPDCs pretreated with PD98059 or U0126 and stimulated with MYO-S for 12 or 24 h (n = 3). Data are expressed as the mean ± SEM of independent experiments. ***P < 0.001 compared with untreated aEPDCs; †††P < 0.001 compared with MYO-S; one-way ANOVA and Bonferroni’s post hoc test.

