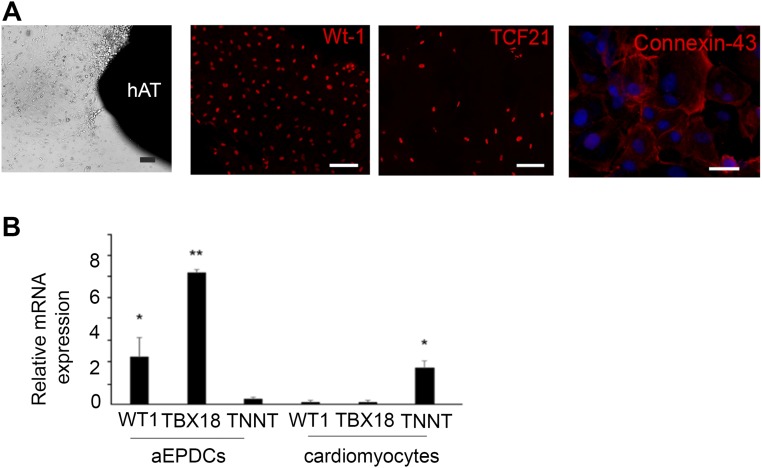
Fig. S2.
Characteristics of aEPDCs. (A) Light microscopy images of human aEPDCs after migration from human atrial tissue (hAT) at day 1 and immunofluorescence staining for WT1, TCF21, and Connexin-43 (n = 6). (Scale bars, 20 µm.) (B) RT-qPCR analysis for WT1, TBX18, or TNNT mRNA expression in aEPDCs and cardiomyocytes from human atrial tissue (n = 5). Data are expressed as the mean ± SEM of independent experiments. Statistical tests used one-way ANOVA, and significance was determined by Bonferroni’s post hoc test. *P < 0.05, **P < 0.01.

