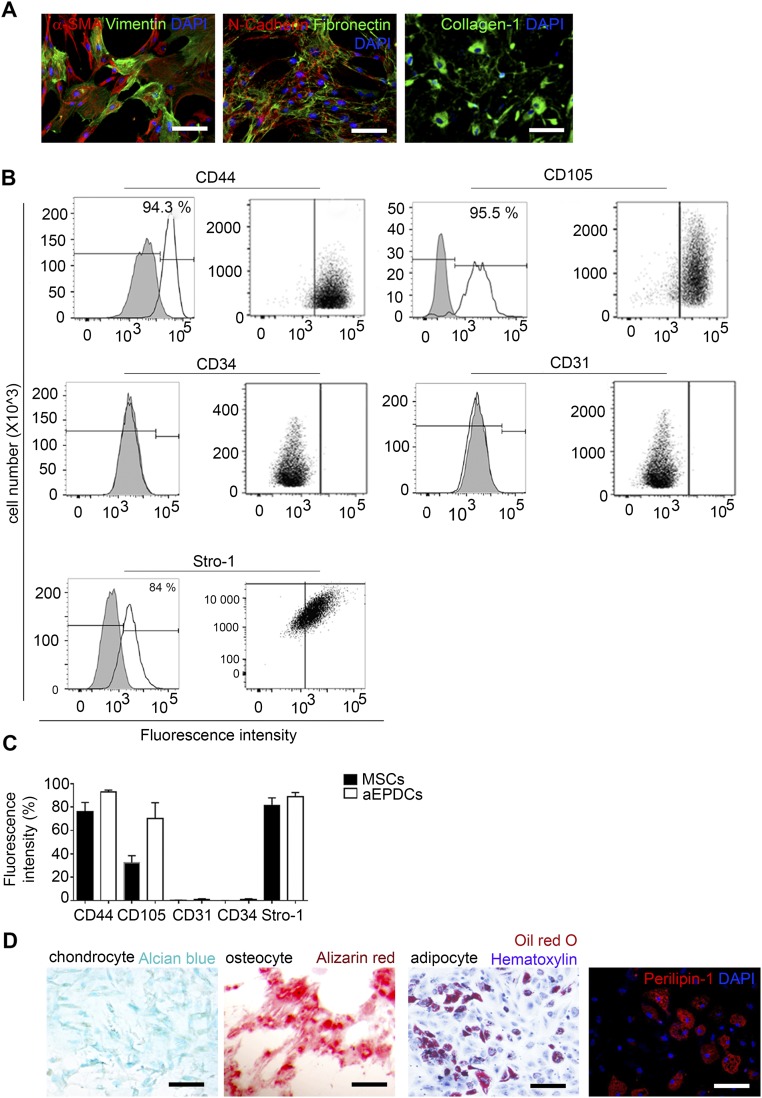
Fig. S3.
Characteristics of MSCs. (A) Immunofluorescence staining for α-SMA, vimentin, N-cadherin, fibronectin, collagen-1, and DAPI (n = 3). (Scale bars, 20 µm.) (B) Flow cytometry analysis of MSC expression of CD44, CD105, CD31, CD34, and Stro-1 (n = 3). Specific isotype controls are shown in gray. (C) Histogram showing fluorescence intensity analyzed for aEPDCs (n = 10) and MSCs (n = 8). Data are expressed as the mean ± SEM of independent experiments. Statistical tests used one-way ANOVA, and significance was determined by Bonferroni’s post hoc test. (D) Bright-field images of MSC-derived chondrocytes, osteocytes, or adipocytes revealed by alizarin red, Alcian blue, and Oil Red O/hematoxylin staining, respectively, and immunofluorescence for Perilipin-1 in MSCs (n = 3). (Scale bars, 20 µm.)

