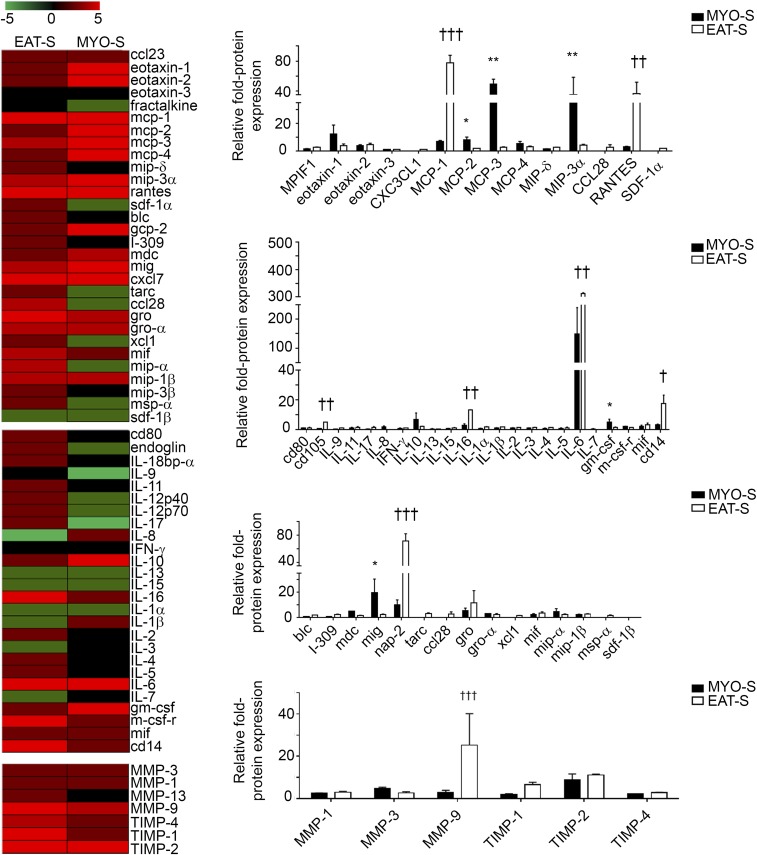
Fig. S6.
Proteins present in MYO-S and EAT-S. Screening and histograms show chemokines, cytokines, and proteases present in MYO-S (n = 8) or EAT-S (n = 8). Data represent the fold change compared with basal medium and are expressed as the mean ± SEM of independent experiments. *P < 0.05, **P < 0.01 compared with EAT-S; †P < 0.05, ††P < 0.01, †††P < 0.001 compared with MYO-S, one-way ANOVA and Bonferroni’s post hoc test.

