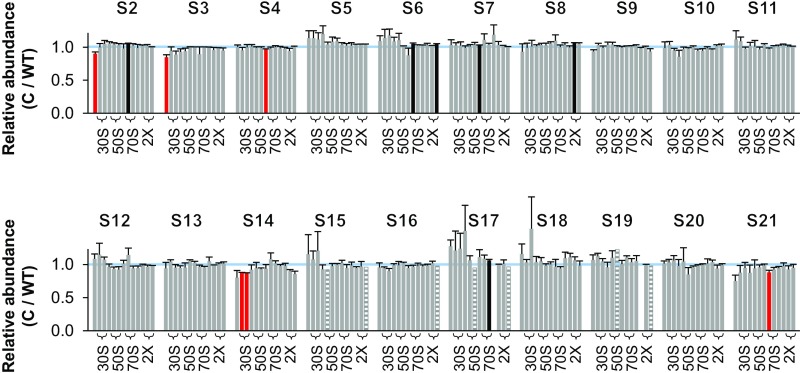
Fig. S6.
Ribosomal protein composition of SSU particles in the complemented ΔrsgA/rsgA+ strain. Shown are normalized isotope ratios (complemented versus wild type; C/WT), indicating the relative abundance of each protein (as indicated) in SSU particles contained in fractions 6–18 of the sucrose gradient. Fractions 7–8, 10–11, 13–14, and 17–18 encompass the 30S, 50S, 70S, and disome (2×) peaks, respectively (as indicated with braces). Four independent experiments were performed, and the data represent the mean ± SEM. Red and black bars indicate values deemed <1.0 and >1.0, respectively, based on Student’s t test (uncorrected P < 0.05). Striped bars denote cases where only one measurement was obtained. The blue line marks 1.0.

