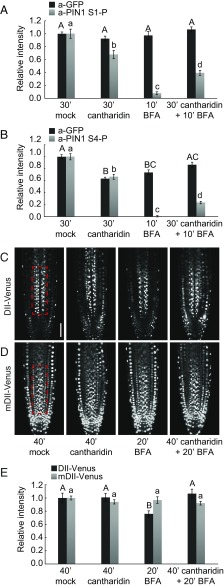
Fig. 2.
Cantharidin inhibits PIN1 dephosphorylation and alters auxin distribution patterns. (A and B) Quantification of fluorescence intensity in the root stele after immunostaining following BFA (50 µM, 10 min) and cantharidin or mock (30 min) treatments. The average from three independent experiments is shown (total n ≥ 44). Representative images of entire roots immunostained with a-PIN1 S1-P and a-PIN1 S4-P as used for quantifications are shown in Fig. S7. (C and D) Representative live fluorescence microscopy images of root tips of 4-d-old Arabidopsis seedlings expressing the auxin-sensitive DII-VENUS (C) or the auxin-insensitive mDIl-VENUS markers (D) subjected to BFA (50 µM, 20 min) and cantharidin or mock (40 min) treatments. (Scale bar, 50 µm.) (E) Quantification of fluorescence intensities in the framed areas of the root stele after live imaging as shown in C and D. The average from three independent experiments (n ≥ 21) is shown. The slightly longer treatments in C–E were chosen because the downstream responses of the primary effects shown in A and B were being examined. In A, B, and E, Student's t test datasets with no statistical difference fall in one group and were labeled accordingly. Upper and lowercase letters serve to distinguish the results obtained with the different series.

