Fig. 3.
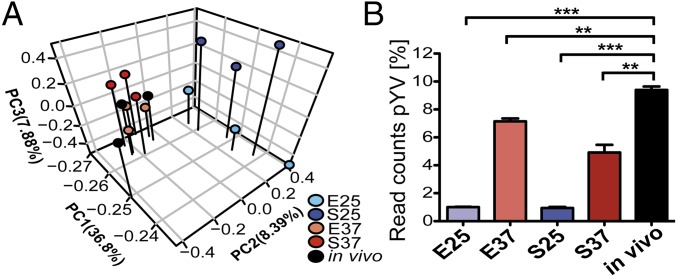
Temperature as a major stimulus for virulence plasmid expression in vivo. (A) Principal component (PC) analysis of reads per kilobase transcript length per million mapped reads-normalized expression values of in vitro and in vivo RNA-seq data for the IP32953 pYV virulence plasmid (NC_006153.2). (B) Percentage of pYV cDNA read counts obtained from in vitro and in vivo RNA-seq data relative to the read counts obtained for the bacterial chromosome. Unpaired t test (n = 3). E25, exponential phase 25 °C; E37, exponential phase 37 °C; in vivo, infected Peyer’s patches; S25, stationary phase 25 °C; S37, stationary phase 37 °C. **P ≤ 0.01; ***P ≤ 0.001.

