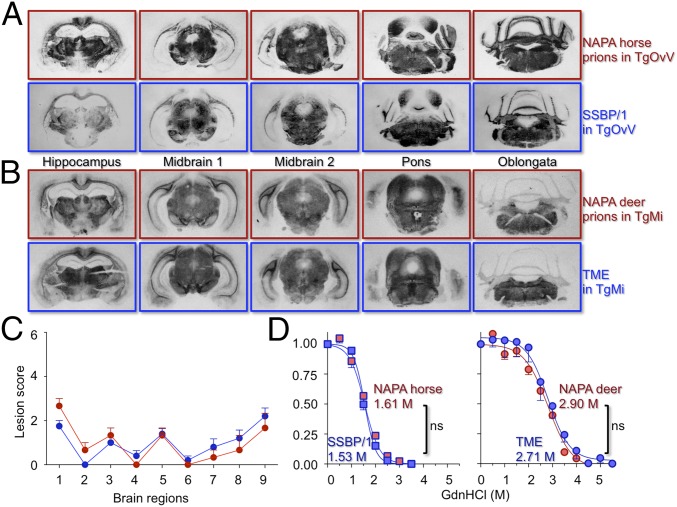
Fig. 2.
Neuropathology and PrPSc properties in representative mice infected with NAPA prions and ancestral counterparts. PrPSc distribution in PK-treated, mAb 6H4 probed histoblots of (A) TgOvV infected with SSBP/1 (blue panels) or NAPA horse prions (red panels). (B) TgMi infected with TME (blue panels) or NAPA deer prions (red panels). (C) Extent of vacuolar degeneration in hematoxylin and eosin-stained, paraffin-embedded sections of the following: 1, medulla; 2, cerebellum; 3, midbrain; 4, hypothalamus; 5, thalamus; 6, hippocampus; 7, paraterminal body; 8, cerebral cortex/hippocampus; and 9, cerebral cortex/septum. A vacuolation severity score of 0, for none, and 4 (maximum) was recorded. Error bars, average score per field ± SEM. TME-infected TgMiF431 brains (n = 5, blue circles) or NAPA deer prions (n = 3, red circles). (D) Percentage of protease-resistant PrPSc as a function of Gdn.HCl concentration. Fapp, fraction of apparent PrPSc = (maximum signal – individual signal)/(maximum signal – minimum signal). The sigmoidal dose–response curve was plotted using a four-parameter algorithm and nonlinear least-square fit. Statistical differences of the GdnHCl1/2 between matched, best-fitted curves were calculated. ns, not significant. Error bars, SEM from three animals per group. Prions from the species of origin, blue; counterpart NAPA prions, red. Shown are TgOvV infected with SSBP/1 (blue squares) or NAPA horse prions (red squares), and TgMi infected with TME (blue circles) or NAPA deer prions (red circles).

