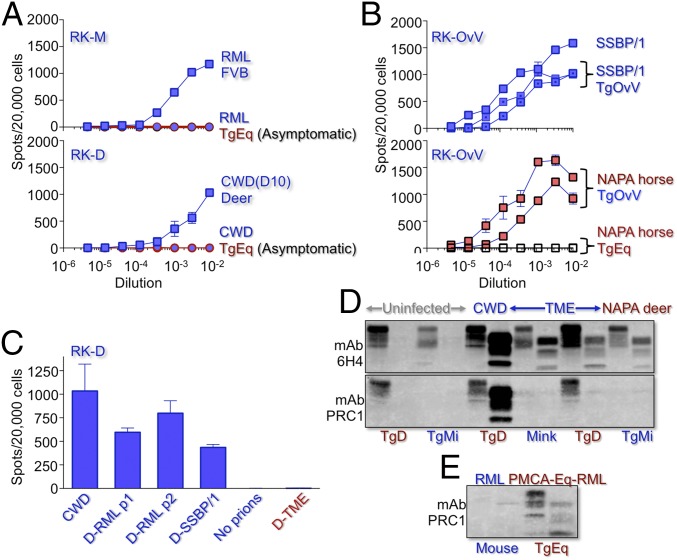
Fig. 3.
Prion replication during NAPA. Cells were challenged with dilutions of 10% brain homogenates in PBS. Mean cell counts were assessed from three plates; error bars, SEM. (A, Upper) RK-13 cells expressing mouse (RK-M) infected with RML from diseased FVB mice (blue squares) or asymptomatic TgEq (blue filled red circles). (Lower) RK-13 cells expressing deer PrPC (RK-D) infected with deer CWD (blue squares) or asymptomatic, CWD-challenged TgEq (blue filled red circles). (B, Upper) Titration of SSBP/1 from sheep (blue squares) or two SSBP/1-infected TgOvV (dotted blue squares) in RK-13 cells expressing sheep (RK-OvV). (Lower) Titration of two TgOvV brains infected with NAPA horse prions in RK-OvV (red filled black squares) and NAPA horse prions from the brain of a diseased TgEq infected with SSBP/1 (clear black squares). (C) Susceptibility of RK-D cells to CWD, and RML and SSBP/1 prions adapted in TgD (D-RML and D-SSBP/1) and to NAPA deer prions from the brain of a TME-infected diseased TgD. Error bars, SEM of at least five replicates. (D and E) Western blots of TgD, TgM, and mink brain extracts probed with mAbs 6H4 and PRC1 that distinguish prions from the species of origin (blue) and adaptation (red). Samples treated (+) or not (–) with PK are shown beneath each lane. In D, PRC1 reacts with CWD but not TME or NAPA deer prions; in E, PRC1 reacts only with PMCA-Eq-RML.

