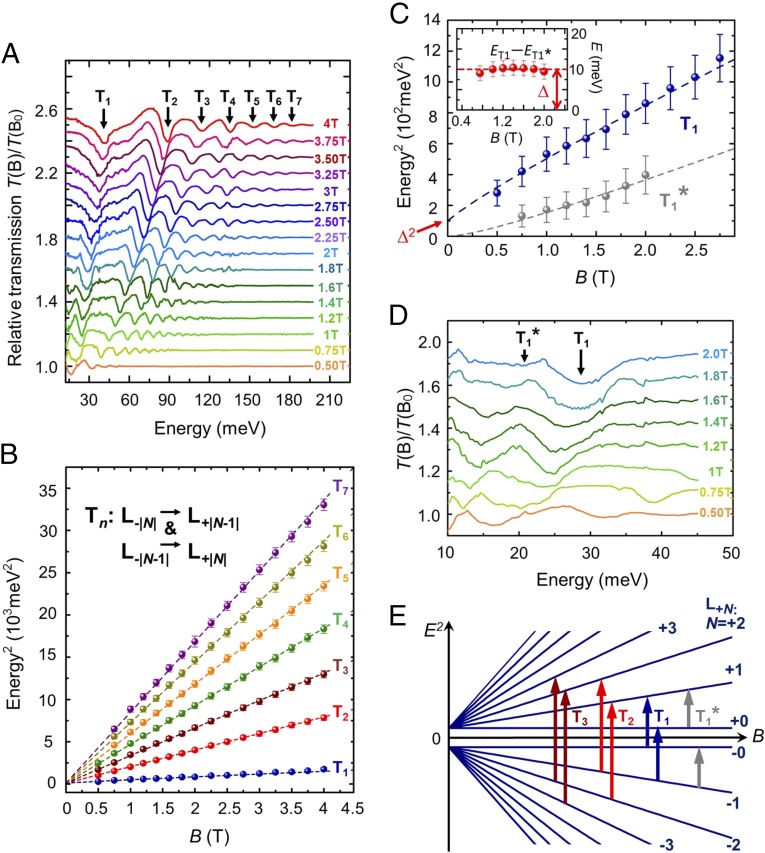
Fig. 2.
Low-magnetic-field Landau level transitions in ZrTe5. (A) Absorption features Tn (1 n 7) in T(B)/T(B0) spectra. The spectra are displaced from one another by 0.1 for clarity. (B, C) Squares of Tn and T1* energies plotted as a function of magnetic field (B 4 T). Tn correspond to the interband LL transitions: (or ). The nonzero at zero field reveals a bandgap ∆. C, Inset shows the energy difference between T1 and T1*, which equals to the bandgap. (D) Absorption features T1* in T(B)/T(B0) spectra. T1*, which is located at energies lower than T1, arises from the intraband LL transition (or ). (E) Schematic of the Landau level spectrum without a Zeeman splitting and the allowed optical transitions, shown in a − plot.

