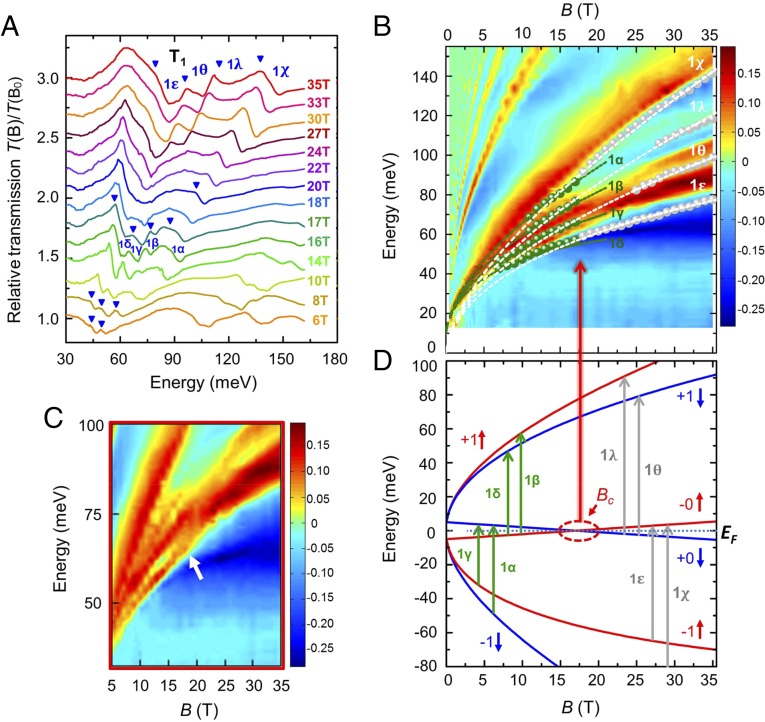
Fig. 3.
Crossing of the two zeroth LLs of ZrTe5. (A) Split T1 transitions in the T(B)/T(B0) spectra at B 6 T. The energies of the split T1 transitions are defined by the onsets of the dip features indicated by the blue triangles. Around 16 T, four modes are present. Four modes reemerge around 27 T. (B) Color scale map of the –ln[T(B)/T(B0)] spectra as a function of magnetic field and energy. (C) Magnified view of a region in B to better present the cusplike feature that is indicated by a white arrow around 18 T. The measured T1 (green dots) and T1* (gray dots) energies are plotted as a function of magnetic field in B. Here, the green and gray dots in B can be extracted from the lower-energy edges (i.e., the onsets) of the peak-feature traces in the color intensity plots (i.e., B and C) of the –ln[T(B)/T(B0)] spectra. These dots in B have the intensities of the color scale, respectively: 0.025 for 1, 1, 1, and 1, –0.025 for 1, 1, and 1 and –0.075 for 1. The theoretical T1 and T1* energies, based on Eqs. 5 and 6 with the g factors: geff(LL−1) = 31.1, geff(LL+1) = 9.7, and geff(LL+0) = geff(LL−0) = 11.1, the bandgap = 10 meV, the Fermi velocities 4.76 105 m/s, and 4.63 105 m/s, are shown by the green and gray dashed curves, respectively. (D) Schematic of the split T1 (green arrows) and T1* (gray arrows) transitions. The LL spectrum is produced with the above values of the g factors, the bandgap and the Fermi velocity . The two zeroth LLs cross at a critical magnetic field Bc ∼ 17 T. The chemical potential is roughly at zero energy when the magnetic field is high enough. At B > Bc, the interband LL transitions (1, 1, 1, and 1) are gradually replaced by the intraband LL transitions (1, 1, 1, and 1), which causes the cusplike feature shown in C.

