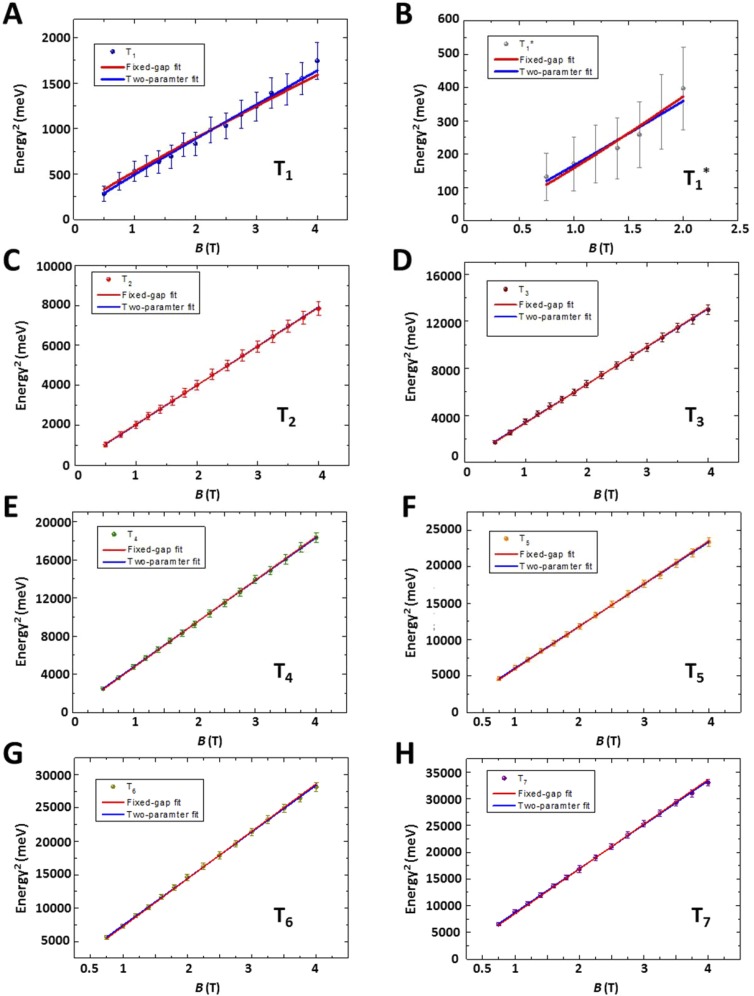
Fig. S2.
Least squares fit for the inter- and intra-LL transitions (Tn and T1*). Squares of T1 (A), T1*(B) and Tn (C–H) energies are plotted as a function of magnetic field. Symbols: experimental data. Blue curve: best fit from the first approach. Red curve: best fit from the second approach. For Tn (7 n 2), ∼ ∼ 0.999. For T1, = 0.988 and ∼ 0.993. For T1*, ∼ ∼ 0.940.

