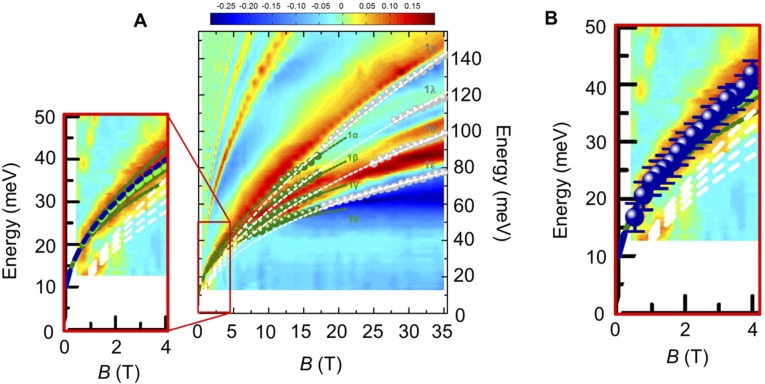
Fig. S5.
Comparison of the two ways for defining the T1 transition energy. (A) Split T1 mode energies as a function of B and four olive dashed curves for fitting the inter-LL transitions T1. The close-up image shows a royal blue dashed curve for fitting the low-field minimal position of T1 and a green dashed curve representing the average energy of the four olive dashed lines. (B) Minimal positions of the dip features T1 (royal blue dots) at B 4 T.

