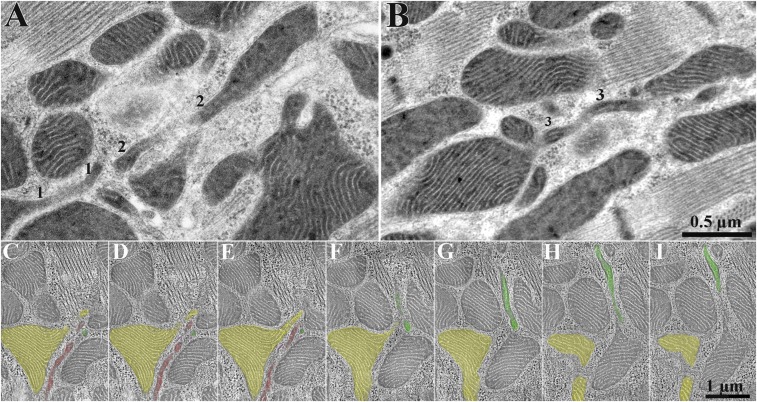
Fig. 3.
The relationship between nanotunnels and small mitochondrial profiles imaged in rapidly frozen RyR2A4860G+/− myocytes. (A and B) In thin sections, the small profiles 1, 2, and 3 belong to three nanotunnels that are partly included in the section thickness and generate small apparently separated profiles at the edge of the section. (C–I) Sequential images taken from a tomogram of a 0.4-μm section (235 images recorded) provide images equivalent to those in thin sections (Movie S1). Three different colors identify profiles that appear continuous in some part of the tomogram but contribute to apparently separate profiles in other views. Microtubules colored in purple (C–G) follow the path of nanotunnel profiles (Movies S1 and S7).

