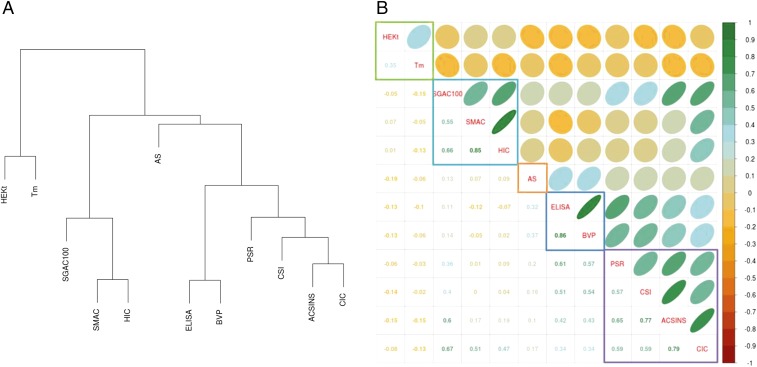
Fig. 2.
(A) Hierarchical clustering of biophysical properties. (B) Matrix and clustering representation of biophysical properties. The lower triangle shows Spearman correlation coefficients, and the upper triangle shows a graphic representation of the same correlation values. The values for SGAC100 were negated before calculating the clustering and correlation coefficients, because its direction of favorability is opposite to HIC and SMAC. The eccentricity of the ellipses is proportional to the magnitude of the correlation coefficient. The slope of the major axis has the same sign as the correlation coefficient.

