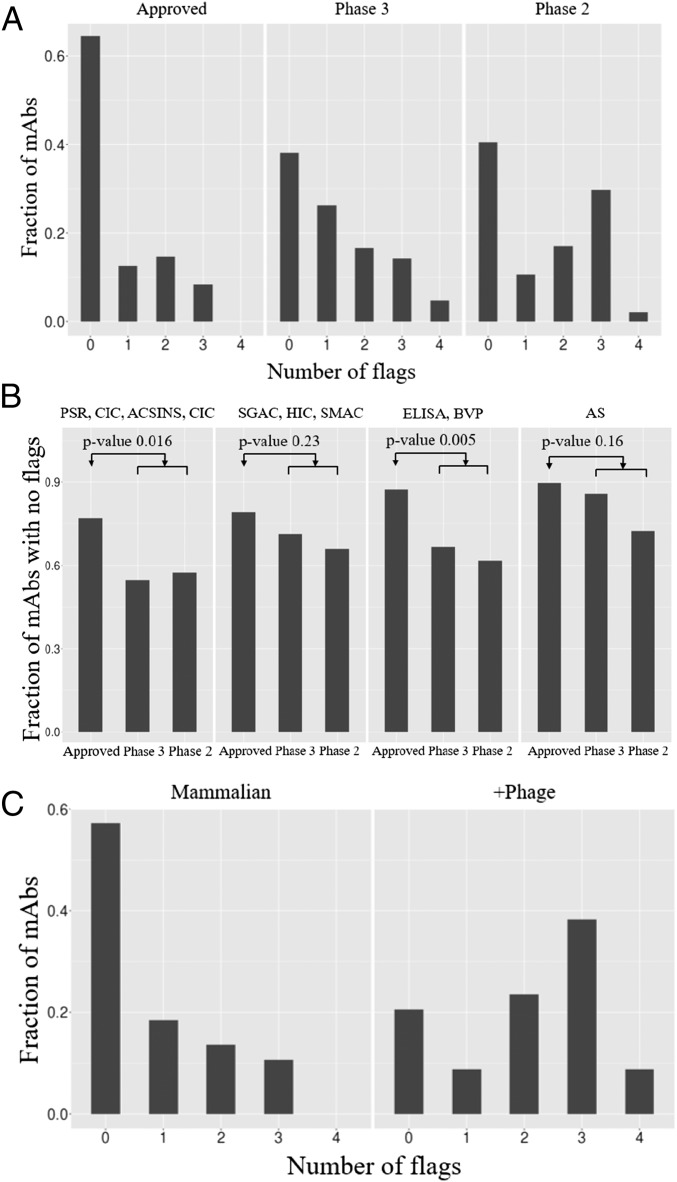
Fig. 3.
(A) Histogram showing number of flags as a function of antibody status in the clinic. For each antibody, a cluster of biophysical properties contributes a value of one to the number of flags if any constituent assay exceeds the thresholds listed in Table 1. (B) Statistical significance analysis of flags per cluster of biophysical properties as a function of clinical progression. (C) Histogram showing number of flags as a function of origin of antibody; +Phage indicates antibodies discovered directly or assisted by phage selection or screening.

