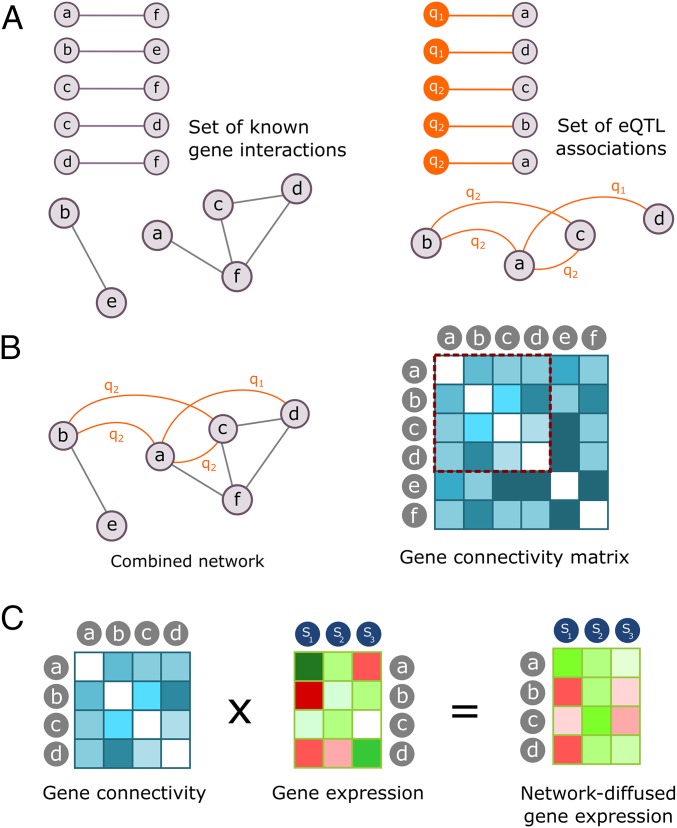
Fig. 1.
An overview of the NBDI approach. Letters a–f represent genes, q1–q3 are eQTL, and S1–S3 are samples (xylem samples from individual trees). (A) Prior knowledge and eQTL associations are converted to a prior and functional interaction network, respectively. (B) The two networks are integrated to construct a combined network, and a gene–gene connectivity matrix is calculated (bright and dark colors show high and low connectivity, respectively). (C) The connectivity matrix (genes not present in the expression data are omitted) is used to diffuse gene expression data through the network.

