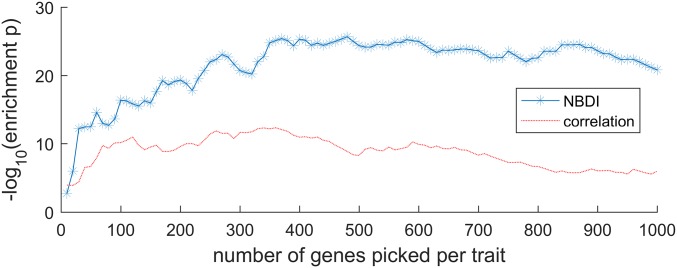
Fig. 2.
Performance comparison of using NBDI-transformed (blue starred line) versus using nontransformed expression correlation data (red line) in prioritizing trait-associated genes. Enrichment probability (y axis; P value obtained using a hypergeometric enrichment test) of the combined gene selection (the union of all of the gene sets that were obtained per trait or, alternatively, the set of genes linked to at least one trait) is shown as a function of the number of genes prioritized per individual trait (x axis).

