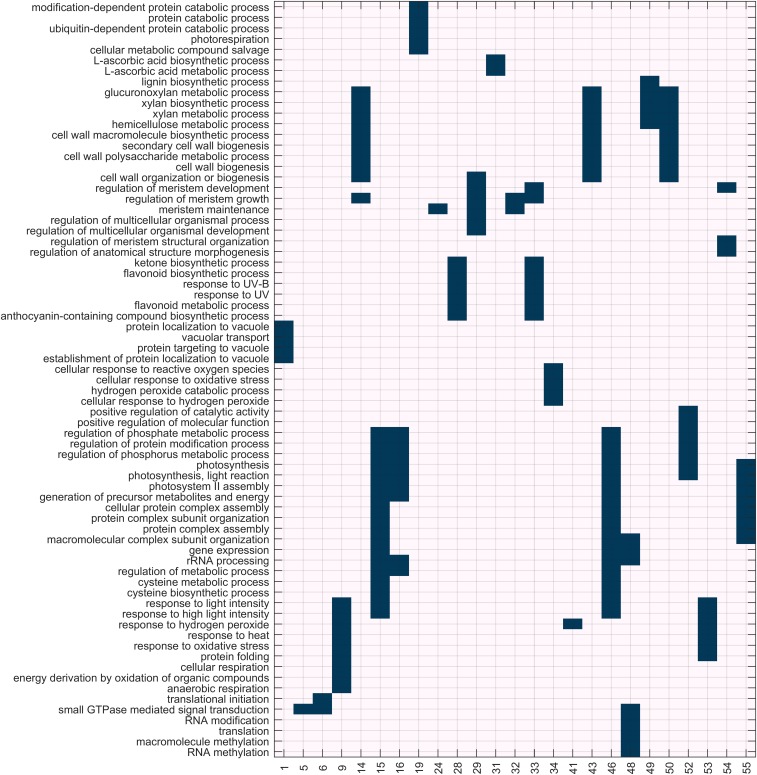
Fig. S4.
GO enrichment (biological process only) of the genes of the combined gene selection that are linked to shared eQTL. The eQTL density peaks (column headings) are numbered as identified in Fig. 3. Peaks with no significant enrichment were omitted. First, for each peak, the five most significant GO terms were selected (limited to FDR corrected P ≤ 0.05; full enrichment results can be found in Dataset S3) to obtain a set of gene functions of interest. The matrix then indicates whether the genes in a peak are significantly enriched for this function set of interest.

