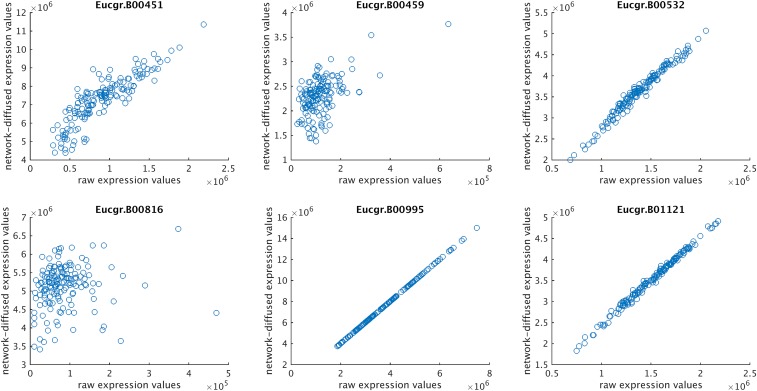
Fig. S6.
Effect of network-based expression diffusion for six selected genes. NBDI-transformed gene expression (y axis) is plotted against the original, nontransformed gene expression (x axis) for a selection of genes that are known to participate in the biological processes underlying the traits under study (cell wall polysaccharide genes). The more a gene is connected to other genes in the gene–gene connectivity network, the more its original gene expression signal will be influenced by the expression values of neighboring genes; that is, genes with low connectivity are least affected by NBDI transformation (and have higher correlation with the raw gene expression values).

