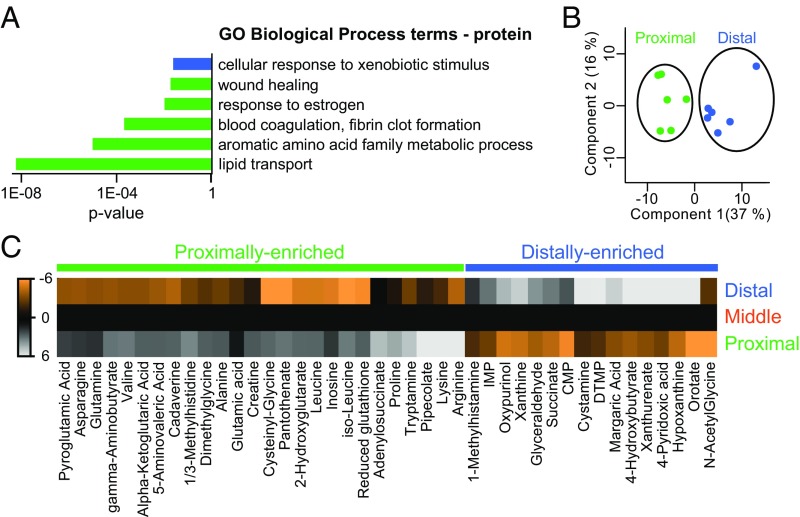
Fig. 4.
Metabolites are differentially expressed along the proximodistal axis of the fin. (A) Annotations for GO Biological Process terms were performed for protein. Proximally enriched (green) and distally enriched (blue) proteins (FDR < 5%) were examined as separate groups by using g:Cocoa (under g:Profiler) with Best per parent group hierarchical filtering. Statistically significant GO terms had P < 0.05. (B) PCA of metabolite abundance from proximal (green) and distal (blue) regions; points represent individual fish. (C) Heat maps of 42 metabolites with proximally enriched (green) or distally enriched (blue) gradients. Each metabolite was differentially abundant (FDR < 5%) between proximal and distal regions. The metabolite values shown are the abundance averages from all biological replicates, normalized to the middle region, and then log2 transformed.

