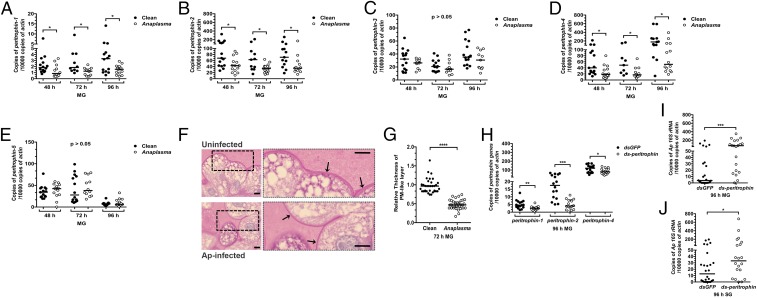
Fig. 2.
The PM influences colonization of the tick by A. phagocytophilum. (A−E) A. phagocytophilum influences the expression of (A) peritrophin-1, (B) peritrophin-2, (C) peritrophin-3, (D) peritrophin-4, and (E) peritrophin-5 in the tick gut (MG) as assessed by qRT-PCR. Results were pooled from three independent experiments, and statistical significance was calculated using a two-tailed nonparametric Mann−Whitney test (*P < 0.05). (F) PAS staining of Carnoy’s fixed and sectioned fed guts from uninfected and A. phagocytophilum-infected nymphs. Boxed outlines within the images on the left have been magnified 2.5×. Arrows indicate the PAS-positive PM-like layer. (Scale bar, 10 μm.) (G) Quantification of the relative thickness of the PM-like layer from uninfected and A. phagocytophilum-infected nymphal guts (MG). (H−J) The qRT-PCR examination of the expression of (H) peritrophin-1, peritrophin-2, and peritrophin-4 upon peritrophin dsRNA mixture injection of nymphal ticks, and qRT-PCR expression of the A. phagocytophilum burden in (I) guts (MG) and (J) salivary glands of dsgfp- and ds-peritrophin-injected nymphs fed on A. phagocytophilum-infected mice. Each dot represents one nymph. Horizontal bars represent the median. Statistical significance was calculated from three independent experiments using a two-tailed nonparametric Mann−Whitney test (****P < 0.0001; ***P < 0.001; **P < 0.01; *P < 0.05).

