
Figure 1. Classification of dentate gyrus units.
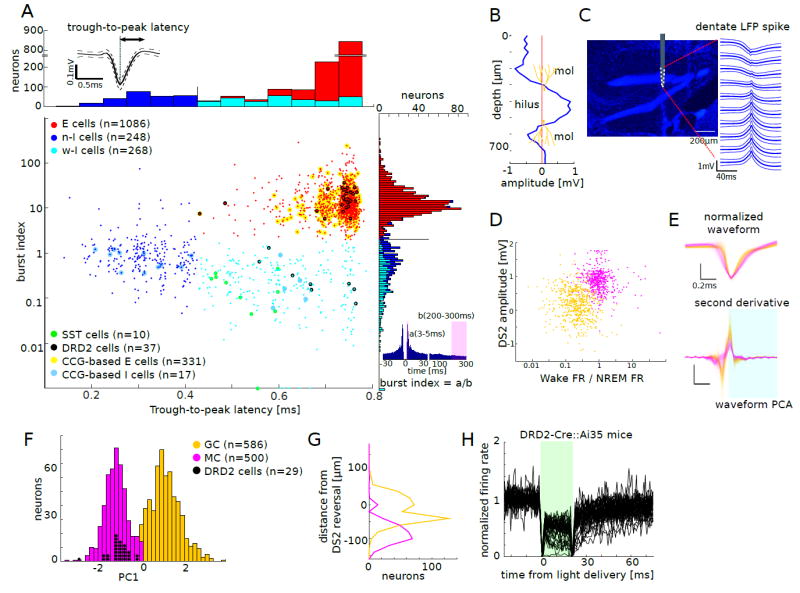
(A) Units (n = 1602 from 15mice) were first classified based on trough-to-peak latency and burst index. Each dot corresponds to one unit (Gaussian noise with s.d. = 0.012 was added to the trough-to-peak latency for the sake of visibility). Units with trough-to-peak latency < 0.425 ms were classified as narrow-waveform putative interneurons (n-I cells, blue). Wide-waveform units were grouped into putative excitatory cells (E cells, red; burst index>1.8) and wide-waveform putative interneurons (w-I cells, cyan) based on the bimodality of the marginal distribution for the burst index (right). Top left inset: average waveform (±SD) of a single unit. Optogenetically identified somatostatin-containing (SST) cells are marked by green circles and dopamine receptor D2 (DRD2) cells by black circles. E and I cells identified by short latency spike cross-correlogram (CCG) are marked by yellow (CCG-based E cells) and blue circles (CCG-based I cells), respectively. Top inset: example averaged waveform (mean ± s.d.). Bottom right inset: burst index, number of spikes in the 3–5 ms bins divided by the average number of spikes in the 200–300 ms bins.
(B) Depth profile of the amplitude of DS2 recorded with a 32-site linear probe (25 μm spacing). mol: molecular layer.
(C) Left: 10-site silicon probe shank overlaid on the image of histologically reconstructed track (DAPI, blue) at the estimated depth. Right: average LFP DS2 at different recording sites (mean ± s.d.).
(D) E units displayed as a function of DS2 amplitude and the ratio of the firing rate during wake and NREM. Yellow: putative granule cells (GC), magenta: putative mossy cells (MC).
(E) Top: overlaid amplitude-normalized average waveforms of all E units. Bottom: second derivative of the normalized waveforms. Shaded period was used for waveform PCA. Scale bar: 0.2ms
(F) Bimodal distribution of PC1, which was obtained after the second PCA, using four parameters: DS2 amplitude, the ratio of the firing rate during wake to NREM, w-PC1 (after waveform PCA), and w-PC2 (see Figure S4A-C). Based on the bimodality of the distribution, K-means clustering over the four parameters was performed to classify E units into putative GC (yellow) and MC (magenta).
(G) Distribution of depth locations of the recorded E units referenced to DS2 reversal (0). MC were located significantly deeper than GC (P<0.001; Mann-Whitney U-test).
(H) Optogenetic suppression of DRD2 cells in DRD2-Cre∷Ai35 mice, where Arch is specifically expressed in DRD2 cells. 37 units showed decreased firing (> 20 %) upon green light delivery. The large deflections at the onset and offset of the light delivery are due to the photoelectric effects.