
Figure 2. Physiological properties of identified GC and MC.
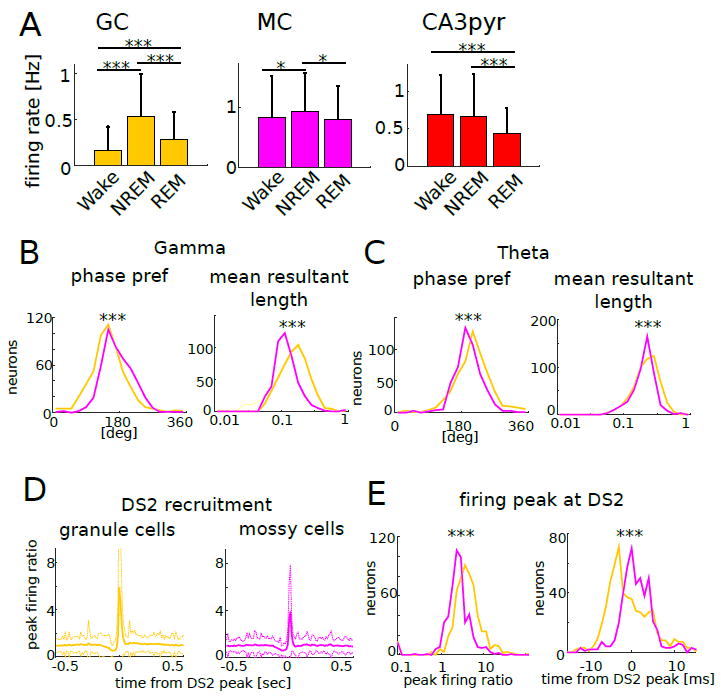
(A) Mean firing rate of each neuron type in different brain states (Wake, NREM, REM). *P <0.05, ***P <0.0001, which applies to all panels in this figure.
(B) Phase preference of individual units (left) and the mean resultant length (right) for gamma oscillations.
(C) Phase preference of individual units (left) and the mean resultant length (right) for theta oscillations.
(D) Peri-event time histogram of GC (left) and MC (right) spikes aligned to the time of the peak of DS2 (mean ± s.d.). Peak firing ratio was calculated by dividing peak firing rate by baseline rate.
(E) Left: distribution of peak firing ratios. GC increased their discharge rates during DS2 significantly more than MC (p < 0.0001, Kruskal-Wallis test). Right: distributions of firing peak timing. GC peaked significantly earlier than MC (p<0.0001, Kruskal-Wallis test). Overall, note that GC were more effectively modulated by gamma, theta oscillations and DS2 compared to MC.