
Figure 3. GC-to-MC spike transmission.
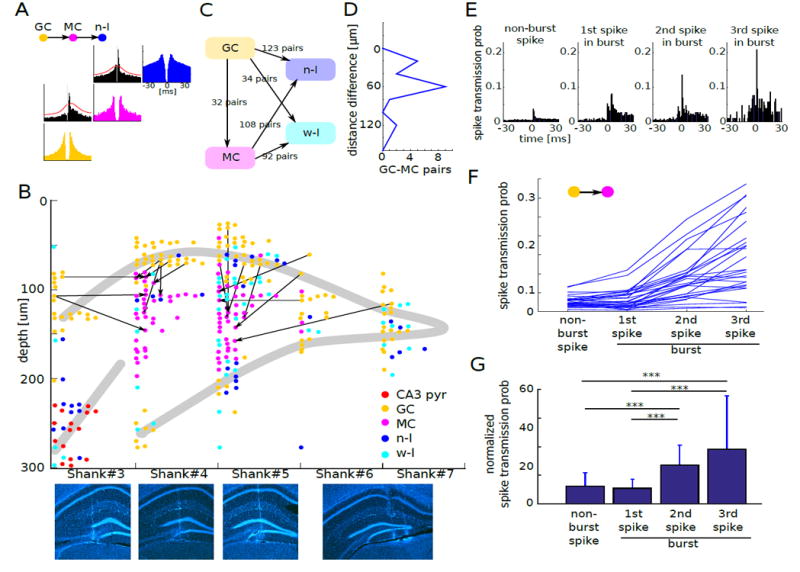
(A) Cross-correlation histogram of an example GC-MC putative monosynaptic pair. MC also showed putative monosynaptic connection to an n-I cell, implying its excitatory nature. Red lines in the cross-correlation histogram mark the statistical threshold for significant detection of outliers from baseline (STAR Methods). Auto-correlograms for each cell type are shown in color as in Figure 1.
(B) Example session of GC-MC putative monosynaptic pairs. Direction of excitatory drive in the cross-correlogram is shown by arrow. Note that arrow direction is toward the hilus of the dentate gyrus, indicating granule cell to mossy cell excitation. Bottom: coronal sections show tracks of each shank (DAPI, blue).
(C) Summary of putative monosynaptic connections among DG units (n = 13 mice).
(D) Distance of cell body locations of monosynaptically connected GC-MC pairs. Depth 0 corresponds to the location of GC. Note that all putative mossy cells reside below the driver granule cell.
(E) Cross-correlation histogram of an example GC-MC putative monosynaptic pair with non-burst spikes, 1st spike, 2nd spike and 3rd spike in bursts.
(F) Change of spike transmission probability as a function of spike order in bursts.
(G) Change of spike transmission probability relative to the baseline as a function of spike order in bursts. ***P < 0.001. These findings demonstrate the strongly potentiating nature of GC-MC synapse.