
Figure 4. State-dependent changes of unit-unit interactions in DG and CA3.
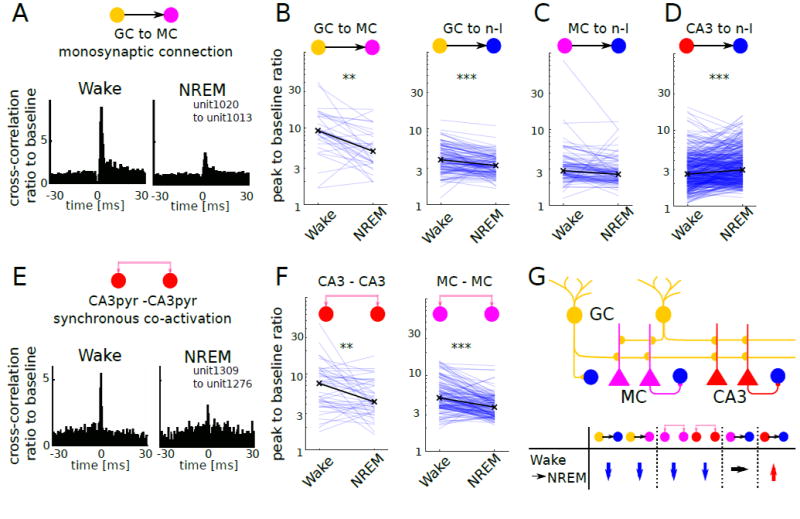
(A) Example GC–MC putative monosynaptic pair shows the decreased spike transmission probability during NREM compared to wake.
(B) GC–MC (left) and GC–n-I (right) monosynaptic pairs show significant decrease of spike transmission probability during NREM (GC–MC: n = 31, P < 0.005; GC–nI: n = 120, P < 0.0001, Wilcoxon signed rank test). Black x: median for each state. ***P < 0.0001, **P < 0.005
(C) MC–n-I monosynaptic pairs (n = 98, P = 0.13, Wilcoxon signed rank test).
(D) CA3 pyramidal–n-I pairs (n = 408, P < 0.0001, Wilcoxon signed rank test).
(E) Example of CA3pyr–CA3pyr synchronous co-activation shows decreased co-activation during SWS compared to wake.
(F) CA3pyr–CA3pyr co-activated pairs (n = 47, P < 0.005, Wilcoxon signed rank test) and MC–MC co-activated pairs (MC–MC: n = 136, P < 0.0001, Wilcoxon signed rank test).
(G) Schema of DG-CA3 local circuit and summary of the state-dependent changes of unit-unit interactions.