
Figure 5. Spatial correlates of GC, MC and CA3 pyramidal cells.
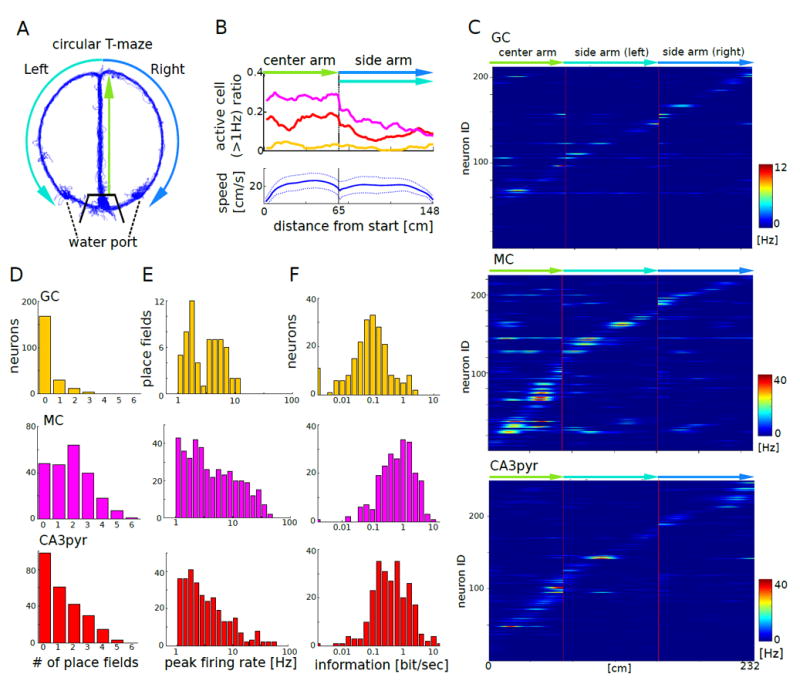
(A) Travel trajectory of a mouse on the circular T–maze (blue). Thick black lines indicate the gates surrounding the waiting area.
(B) Top: fraction of GCs (yellow), MCs (magenta), and CA3pyr (red) active (>1Hz) at each location of the linearized maze. Bottom: running speed (mean ± s.d.).
(C) Firing patterns of GCs (top, n = 213), MCs (middle, n = 225), and CA3pyr (bottom, n = 249) on the linearized maze (n = 9 mice. Each row represents the position-dependent firing rate of a single neuron.
(D) Distribution of the number of place fields of GCs (top), MCs (middle), and CA3pyr (bottom; P<0.001, Kolmogorov-Smirnov test).
(E) Distributions of within-place field peak firing rates (bottom). The distributions were significantly different between GC and MC (P = 0.003, Kolmogorov-Smirnov test) and between MC and CA3pyr (P < 0.001).
(F) Distributions of information measure (bit/s). All comparisons were significantly different from each other (P < 0.001, Kolmogorov-Smirnov test).