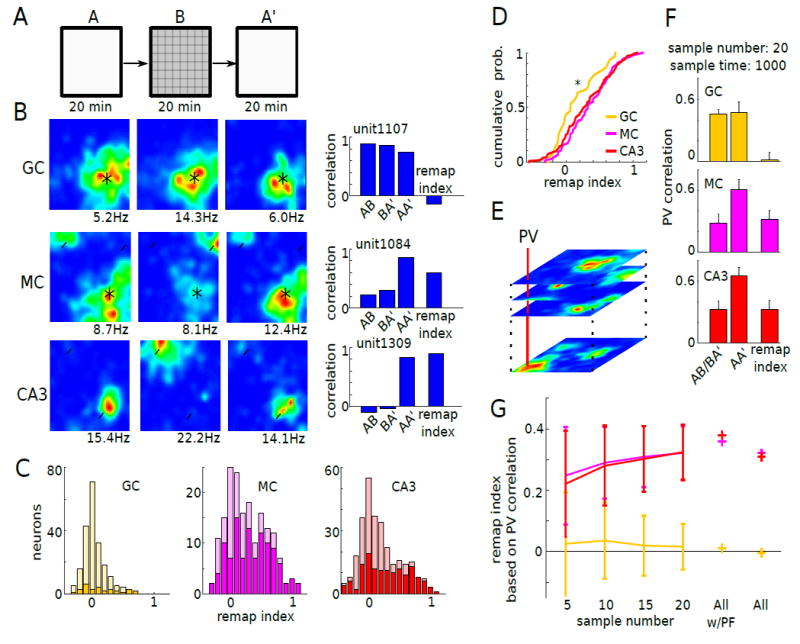
Figure 6. Place field remapping of GC, MC and CA3 pyramidal cells in different mazes.

(A) Mice were tested first in open field A for 20 minutes, then in open field B in the same room for 20 minutes, and again in open field A (A’). Open field A and B had the same size but were made from different materials with different textures.
(B) Left: firing rate maps of example GC (top), MC (middle), and CA3pyr (bottom) in A, B and A’. Right: correlation of firing maps in A–vs–B, B–vs–A’, and A–vs–A’ for the example units. Place field remapping index was calculated by subtracting the mean of the AB and BA’ correlations from the AA’ correlation. Black asterisk: place fields observed both in A and B. White arrow head: place fields observed either in A or B.
(C) Distribution of the remapping index of GCs (left, n = 247), MCs (middle, n = 181), and CA3pyr (right, n = 317; n = 5 mice). Bright colors indicate units with significant place fields (GC: n = 30, MC: n = 111, CA3pyr: n = 144).
(D) GCs with stable place fields had significantly lower remapping index compared to MCs and CA3pyrs with stable place fields (P = 0.033, one-way Kruskal-Wallis test with Bonferroni post hoc test; P = 0.028).
(E) The rate maps of units of the same cell types were stacked into 2500 (50 x 50 pixels) population vectors (PVs; as in Leutgeb et al., 2007).
(F) PV correlation was calculated for AB, BA’ and AA’ for GCs (top), MCs (middle), and CA3pyr (bottom). For calculating PVs, rate maps of 20 units randomly selected from all units with stable place field were stacked. Random sampling was performed 1000 times iteratively for place field shift score calculations.
(G) Remapping index was calculated based on PVs with sets of different sample numbers (n = 5, 10, 15, 20). Remapping index scores, calculated based on PV for all units or all units with stable place fields, are marked by +. Place fields of MCs shifted more compared to those of GCs. All w/PF: all units with place fields.
