
Figure 7. Spatial correlates of the monosynaptically connected GC–MC pairs.
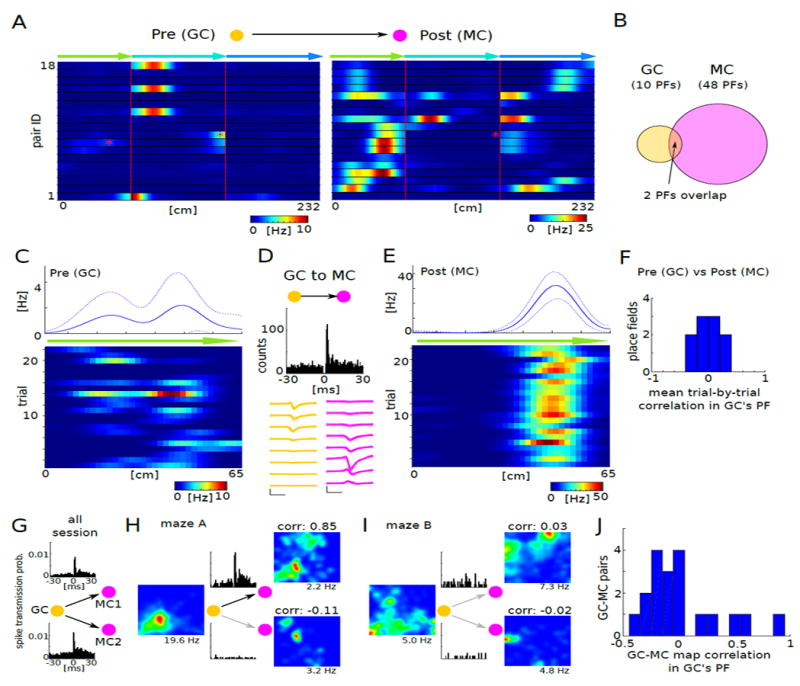
(A) Firing patterns of 18 monosynaptically connected GC–MC pairs (between 16 GC and 17 MC) on the linearized maze. Red asterisks indicate the overlapping place fields of two GC–MC pairs.
(B) Only 2 place fields (PF) showed overlap between GC and MC. Of the 18 GC partners of the monosynaptically connected pairs, only 10 had place fields. In contrast, 18 MC had 48 place fields.
(C,E) Firing rate maps of the pre- and postsynaptic members of a GC–MC pair in the center arm of the maze (top, mean ± s.d.). Bottom: firing patterns of the same neurons, color-coded for each trial.
(D) Cross-correlogram between GC in (C) and MC in (E) shows putative monosynaptic connection. Bottom: average waveform (mean ± s.d.) of the GC and MC.
(F) Correlation of firing rate maps between GC and MC was calculated on a trial-by-trial basis at the locations where GC had place fields. Note median correlation around 0 (P = 0.77, Wilcoxon signed rank test).
(G-J) Correlation of firing rate maps between monosynaptically connected GC-MC pairs in open mazes (n = 3 mice). (G) Baseline cross-correlogram of monosynaptically connected GC-MC triplet. (H) Example rate maps in maze a for GC-MC triplet. One pair (GC-MC1) had high (top) and whereas the other pair (GC-MC2) has low (bottom) correlation between rate maps of granule cell and mossy cell within the granule cell’s place field. Insets: Cross-correlogram of GC-MC pairs, with the same scale as in (G). (I) Example rate maps in maze B. (J) GC-MC map correlations of all comparisons in which the presynaptic GC had significant place fields. Note median correlation around 0 (n = 19, P = 0.60, Wilcoxon signed rank test).