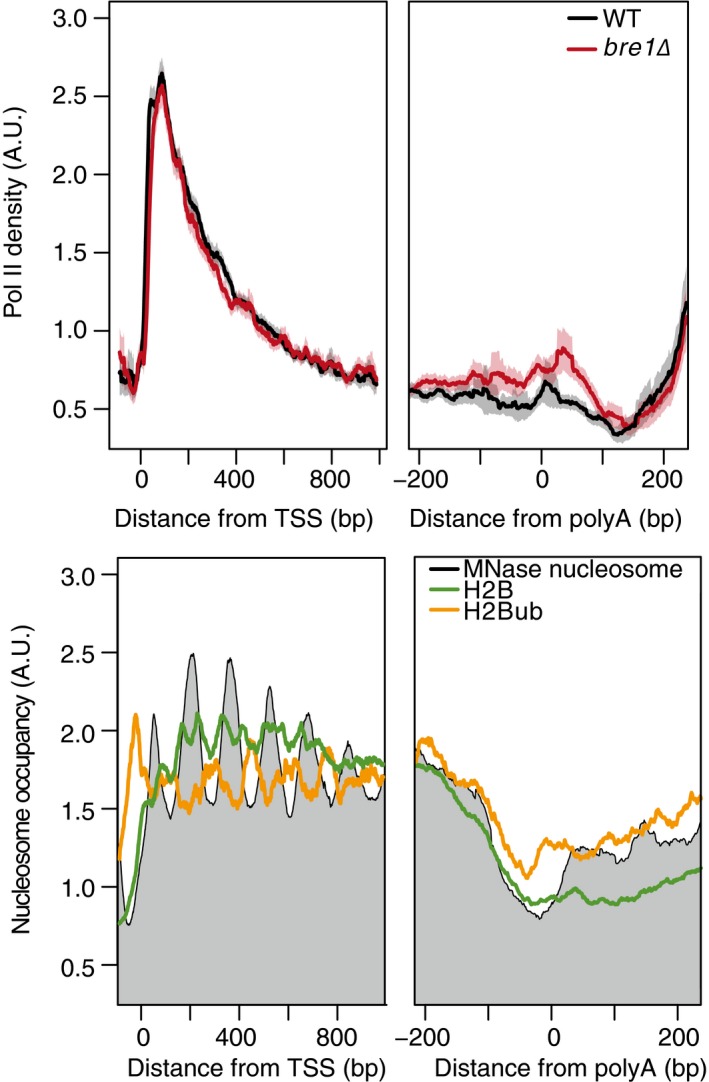
Figure EV3. Bre1 and H2Bub are present on nucleosomes near the polyA site and are not the result of overlap with the plus one nucleosome from neighboring genes.

Top: normalized average NET‐seq profiles for WT and bre1Δ cells around the transcription start site TSS and polyA of protein‐coding genes with non‐overlapping genes that do not overlap with another protein‐coding gene within 350 base pairs, n = 1,120. NET‐seq reads for each gene are normalized by total reads for each gene in the analyzed region; shaded areas represent the 95% confidence interval. Bottom: average normalized MNase seq (gray) or ChIP‐exo for H2B (green), H2B ubiquitylation (H2Bub, gold) around the TSS and polyA sites of the same genes used for the top NET‐seq analysis. MNase‐seq data were obtained from van Bakel et al (2013), and ChIP‐exo data were obtained from Rhee et al (2014).
