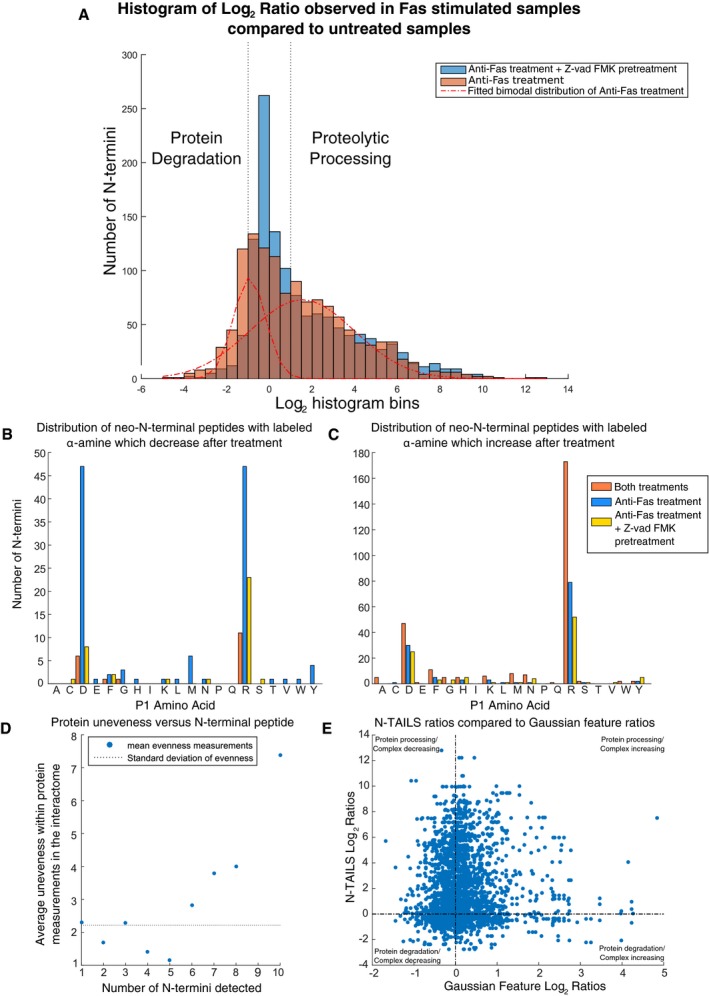
Figure 5. N‐terminal peptide enrichment analysis of Fas‐induced apoptosis.

-
AHistogram distribution of the ratio of observed N‐terminal peptides after Fas treatment and Fas treatment with pre‐treatment with caspase inhibitor Z‐vad‐FMK. The bimodal distribution of N‐termini ratios (r 2 = 0.975) observed for Fas treatment is shown with a similar distribution fitted for Fas treatment with the caspase inhibitor Z‐vad‐FMK (Appendix Fig S14F). The position of log2 1 and log2 −1 is denoted with dotted black lines.
-
B, CThe distribution of the P1 amino acid identified for N‐termini that was determined to be (B) below log2 −1 and (C) above log2 1 are shown. The number of neo‐N‐terminal peptides quantified below log2 −1 and above 1 are shown grouped according to the mapped P1 amino acids. Fas treatment without caspase inhibition is denoted by the blue bar and Fas treatment with the caspase inhibitor Z‐vad‐FMK denoted by yellow with the N‐terminal peptides showing identical changes within each condition shown in orange.
-
DThe observed unevenness of proteins in response to apoptosis compared to the number of N‐termini detected reveals as the number of N‐termini peptides detected increases the average observed unevenness at the interactome level also increases.
-
EComparison of the TAILS ratio versus Gaussian ratios upon FAS treatment vs untreated samples for all combinations of observed TAILS and Gaussian ratios showing only a poor correlation (Spearman correlation: 0.21) between the two values supporting these events being unlinked.
