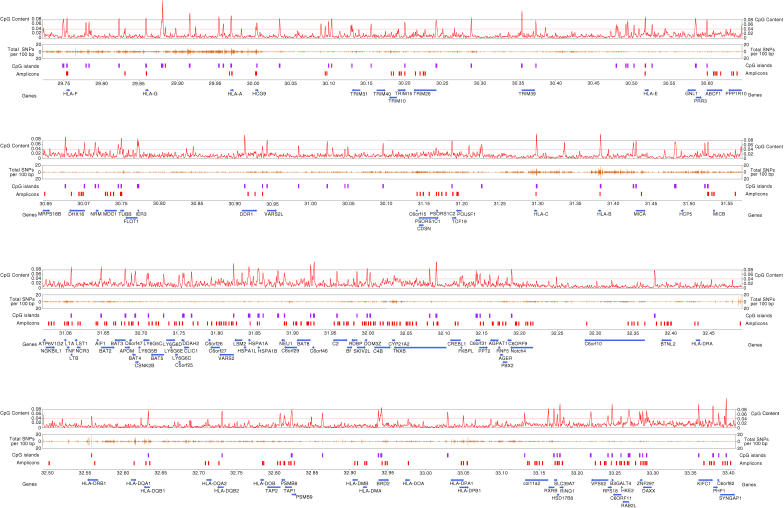
Figure 1. Map of the Human MHC Showing Coverage and Locations of the Bisulphite PCR Amplicons for Which Methylation Data Have Been Generated.
Tracks from top to bottom are as follows. (1) CpG content—the proportion of CpGs in 8-kb windows. The expected proportion of CpG dinucletides is 0.04 based on the background base composition of Chromosome 6 (Mungall et al. 2003). (2) Random SNP density in 1,000-bp windows. (3) Location of predicted CpG islands. (4) Bisulphite PCR amplicons. (5) Location of annotated gene structures. Right and left arrows indicate gene structures on the sense and antisense strand, respectively. Official gene symbols are used where available.

