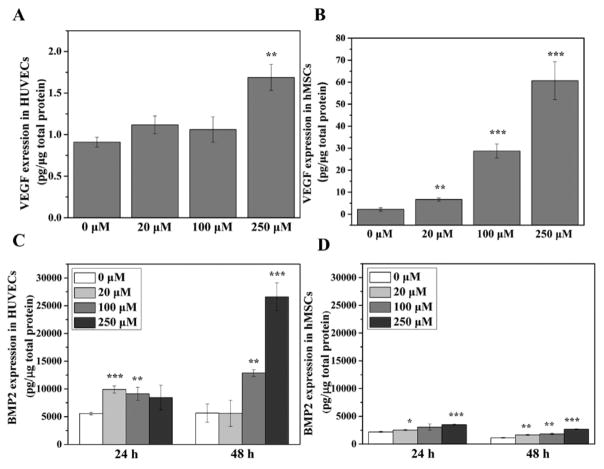
Figure 2.
DFO-induced VEGF and BMP2 expression in HUVECs and hMSCs. VEGF expression in HUVECs (A) and hMSCs (B) was measured after the cells were cultured in medium supplemented with different concentrations of DFO for 24 h (n = 3). BMP2 expression in HUVECs (C) and hMSCs (D) was measured after the cells were cultured in medium supplemented with different concentrations of DFO for 24 and 48 h (n = 3). Data are expressed as mean ± SD (*p < 0.05; **p < 0.01; ***p < 0.001).

