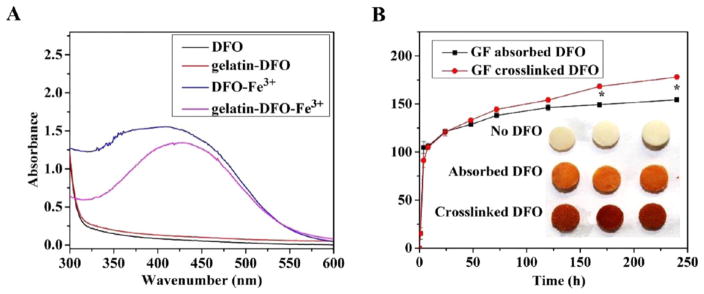
Figure 4.
Iron binding test and in vitro DFO release. UV–vis spectra of aqueous solute irons of DFO, gelatin-DFO, DFO-Fe3+, and gelatin-DFO-Fe3+ (A). DFO released from absorbed (black) or cross-linked (red) GF-DFO scaffolds (B) were measured by UV–vis spectra. The retained DFO in the GF scaffolds after 10 days of release were visualized by captured Fe3+ (inset of B).

