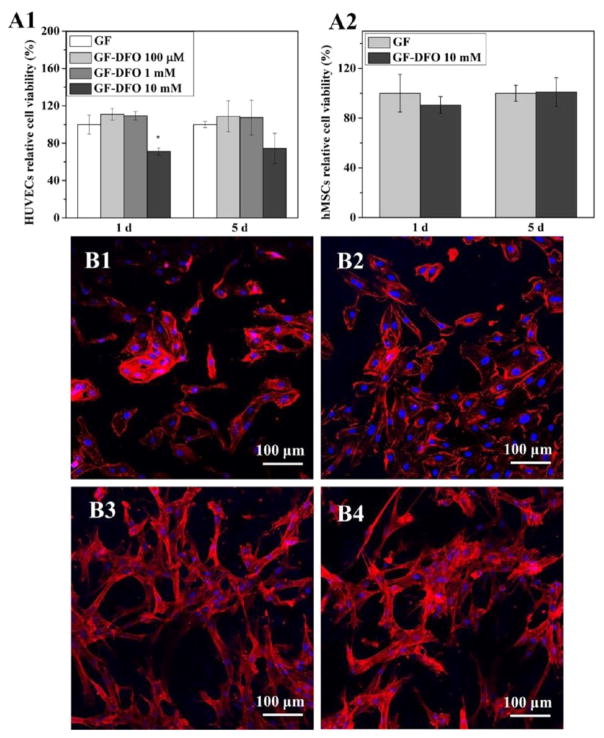
Figure 5.
Cell viability and morphology on DFO conjugated-scaffolds. Cell viability of HUVECs (A1) and hMSCs (A2) were studied after the cells were cultured on GF and GF-DFO scaffolds for 1 and 5 days (n = 3). Confocal images were taken of HUVECs grown on GF (B1) and GF-DFO (B2) scaffolds after 16 h and of hMSCs grown on GF (B3) and GF-DFO (B4) scaffolds after 16 h. Actin cytoskeletons are shown in red, while cell nuclei are shown in blue. Scale bar =100 μm. Data are expressed as mean ± SD (*p < 0.05).

