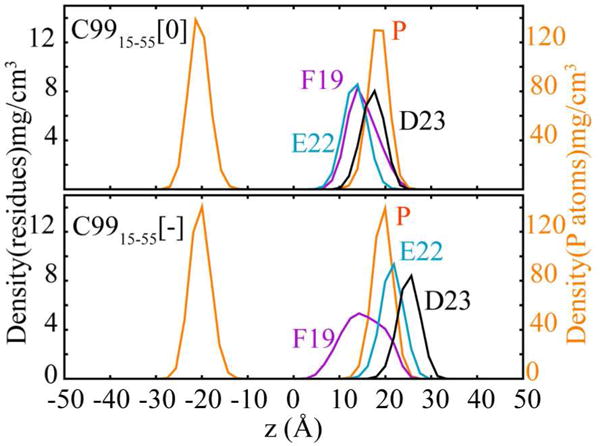
Figure 3.

Density distributions of key residues across the membrane normal (z-axis). The scale for P atom (orange) density distribution is shown on the right, while the scale for densities of side chains is marked on the left. F19, E22 and D23 are colored as magenta, teal and black, respectively. Deeper penetration of E22 and D23 is observed in C9915–55[0] (upper) as opposed to C9915–55[−] (lower).
