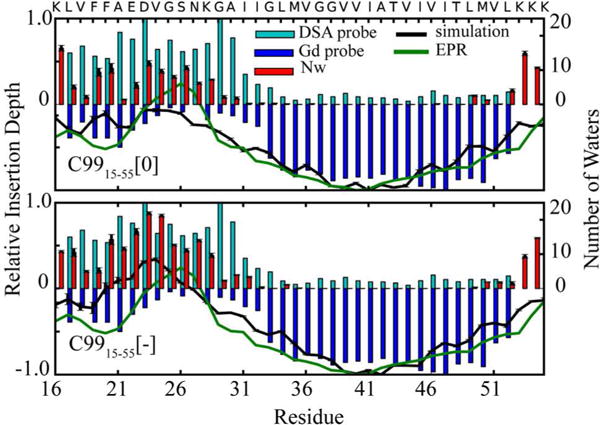
Figure 4.

Insertion depth of each residue in the DMPC+20% cholesterol bilayer (black curve) compared with relative insertion depth from EPR (green)14 and relative variation in NMR chemical shift in the presence of hydrophilic (cyan bars) and hydrophobic (blue bars) probes21. Shown for comparison is the number of water molecules observed within 5Å of each residue in simulation (red bars).
