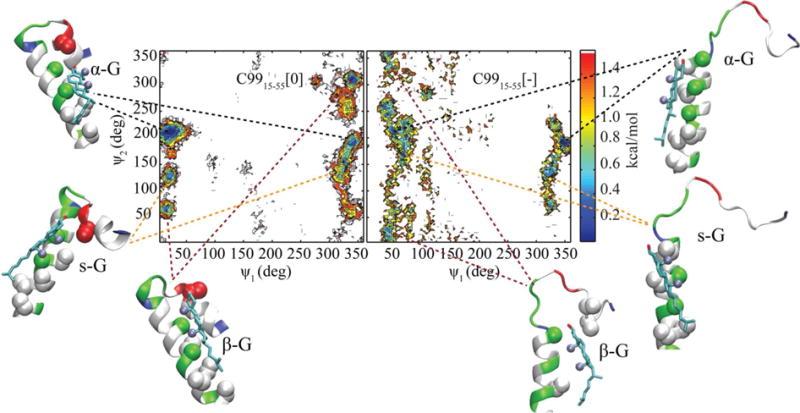
Figure 6.

PMF projected along the ψ1 and ψ2 Crick angles for C9915–55[0] (left) and C9915–55[−] (right). Color bar is in kcal/mol. Representative structures for each basin are illustrated. Residues are colored based on type: hydrophobic (gray), hydrophilic including Gly (green), acidic Asp and Glu (red), and basic Lys (blue). Cα and Cβ atoms of residues within 5Å of cholesterol are depicted with spheres. Cholesterol is colored based on atom types: oxygens (red) and carbons (cyan). Methyl groups of cholesterol are marked by purple spheres. Structures are rendered in VMD24.
