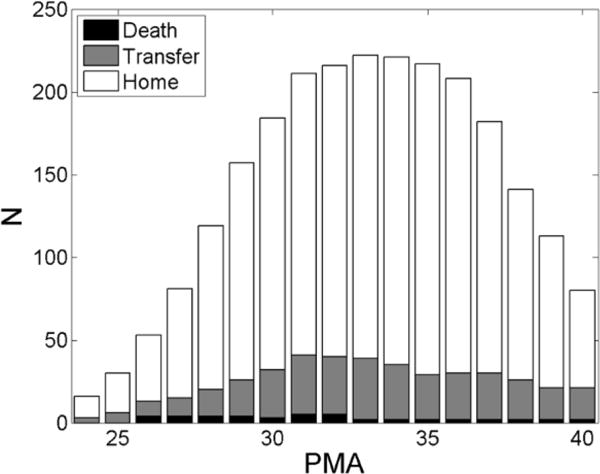
Fig. 1.

Patient data histogram. The histogram shows of the number of patients that had data available for analysis at each PMA. Distinction is made between infants who were discharged to home (white), those who were transferred to another unit or hospital (grey), and those who died (black). Only PMA up to term (40 weeks) are represented.
