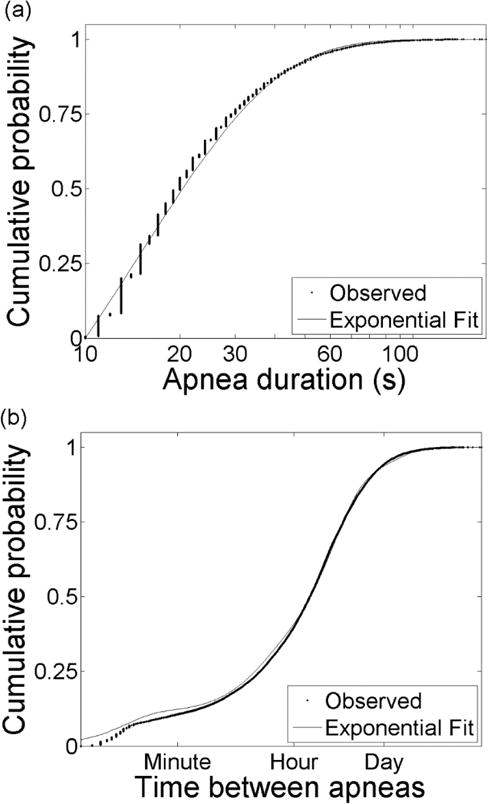
Fig. 2.

Statistics of apnea events. (a) Cumulative distribution of 26,088 apnea durations. Vertical banding in observed data (dots) results from rounding of apnea durations to integer values. The distribution is well-described by an exponential distribution (lines). (b) Cumulative distribution of the logarithm of times between apnea. The data (dots) are well-described by a sum of four exponential distributions (line).
