
Fig. 5.
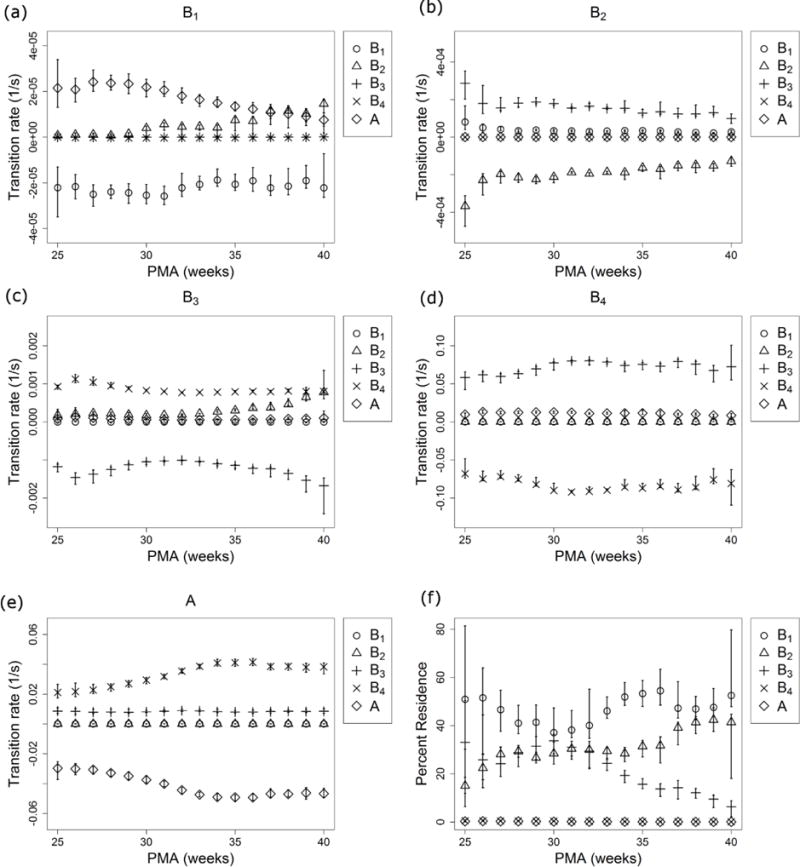
Transition rates vs PMA. Transitions are shown from B1 (a), B2 (b), B3 (c), B4 (d), and A (e) into B1 (circles), B2 (triangles), B3 (plusses), B4 (crosses), and A (diamonds) as a function of PMA. The percentage of time spent in each state is shown in (f) as a function of PMA. Segments above and below each symbol identify the 95% confidence interval and are sometimes smaller than the symbol.