
Figure 2.
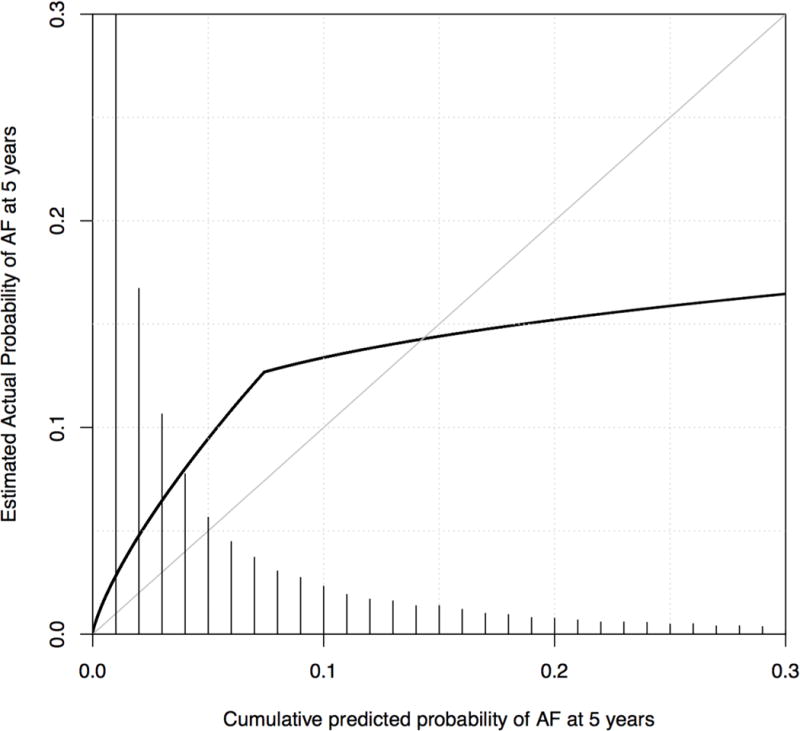
Calibration curve depicting predicted and observed cumulative incidence of atrial fibrillation using the CHARGE-AF model in the Vanderbilt electronic medical record cohort. The figure is restricted to 95% of subjects with predicted cumulative incidence of atrial fibrillation from 0 to 0.3. The diagonal line represents a hypothetical ideal curve where predicted and actual atrial fibrillation probability match perfectly for all levels of predicted risk, representing perfect calibration. The curve shows under-prediction for subjects with a predicted probability of atrial fibrillation 0 to 0.15 and over-prediction for subjects with a predicted probability ≥0.15. A histogram showing the distribution of predicted risk is shown. AF: atrial fibrillation.