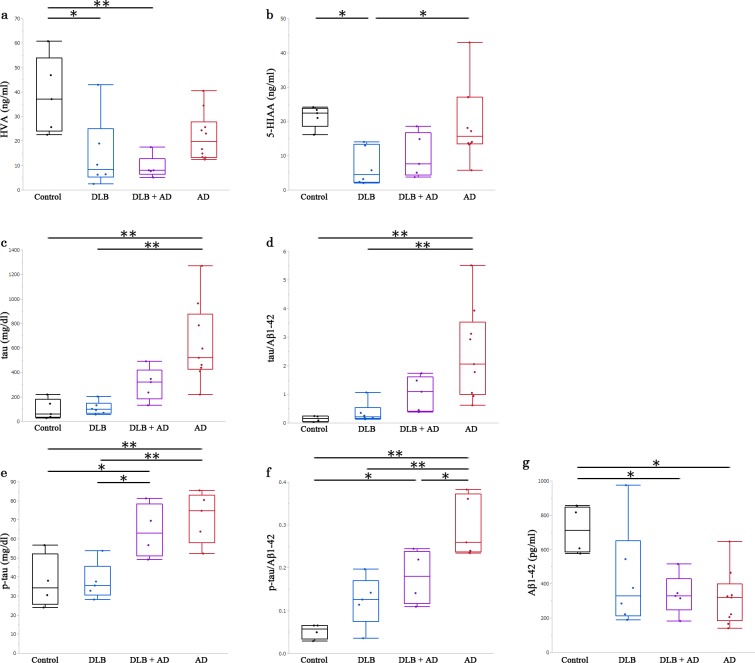
Fig 2. CSF levels of homovanillic acid (HVA), 5-hydroxyindole acetic acid (5-HIAA), tau, phosphorylated tau, and Aβ 1–42.
Each panel shows CSF levels of (a) HVA, (b) 5-HIAA, (c) tau, (e) p-tau, and (g) Aβ 1–42 in the cases of control, DLB, DLB with AD, and AD. Panels (d) and (f) are calculated from the values in panels (c), (e), and (g). We analyzed each between-group difference using the Tukey-Kramer honestly significant difference test. Error bars represent the standard deviations and the bottom, middle, and top lines of the box represent the 25th, 50th (median), and 75th percentiles, respectively. *, p < .05; **, p < .01.

