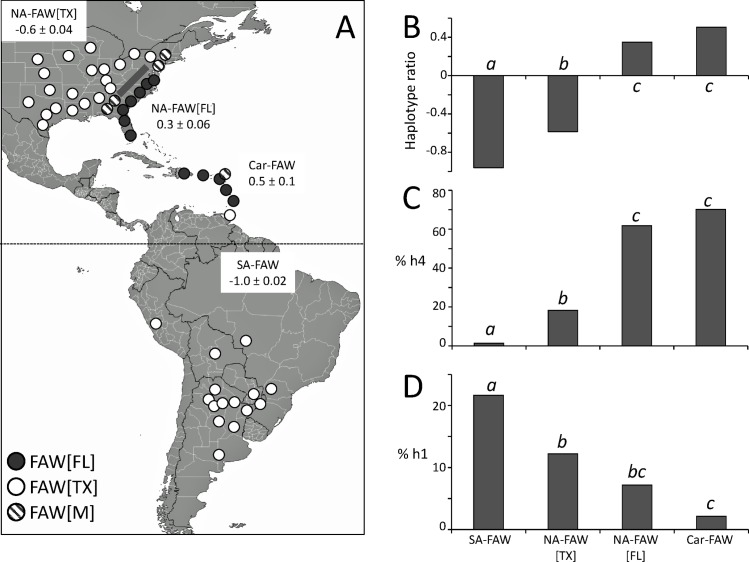
Fig 4. Fall armyworm haplotype ratio distributions in the Western Hemisphere.
A. Hemispheric map of haplotype ratio categories and their segregation into groups based on geography and haplotype ratios. NA-FAW[TX] and NA-FAW[FL] represent collections from the United States with a FAW[TX] or FAW[FL] haplotype ratio profile, respectively. Car-FAW includes collections from the Caribbean not including Trinidad & Tobago. SA-FAW includes collections from South America and Trinidad & Tobago. The mean ratio ± the Standard Error of the Mean (SEM) is indicated. Diagonal line indicates location of the Appalachian mountain range. United States data are from an earlier study [25]. South America data are as described in Fig 1. Graphs B, C, D describe ordinary one-way ANOVA analysis with Tukey's multiple comparisons test. Columns with different lower case letters are significantly different at the P < 0.05 criterium. B. Comparisons of haplotype ratios (F(3, 31) = 113.2, P < 0.0001, r2 = 0.9164). C. Comparisons of the h4 haplotype frequency (F(3, 31) = 99.58, P < 0.0001, r2 = 0.9060). D. Comparisons of the h1 haplotype frequency (F(3, 31) = 15.73, P < 0.0001, r2 = 0.6035). Data used in the ANOVA analysis are in S1 Table.

