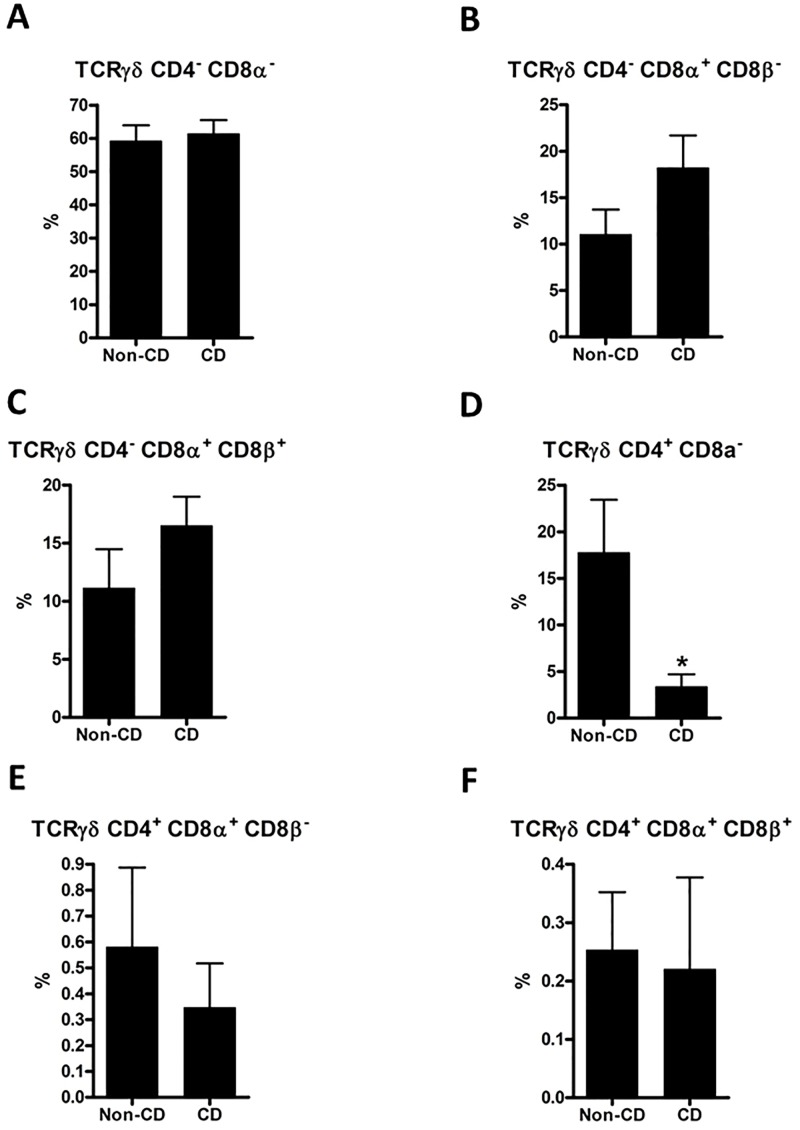
Fig 5. Flow cytometric analysis of intraepithelial TCRγδ subpopulations.
TCRγδ+ subpopulations were analyzed in the same manner as TCRαβ subpopulations in Fig 4. Comparisons were made using a two-tailed unpaired Student’s t-test; error bars represent SEM; *: p<0.05; n = 10 (non-CD controls) and 11 (CD).

