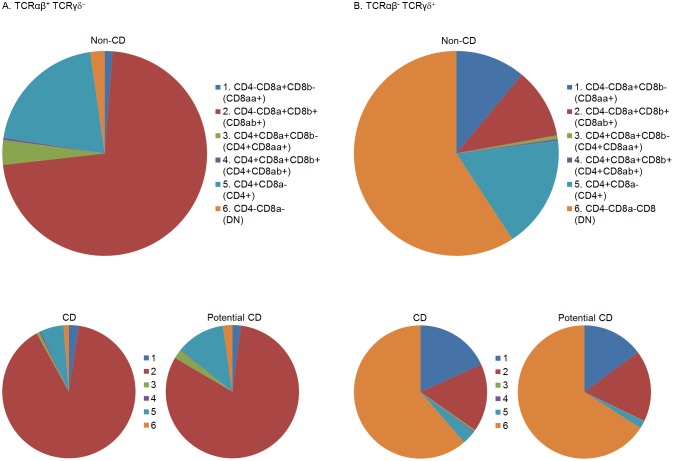
Fig 7. Illustration of the mean flow cytometric proportions of six identified intraepithelial T cell subpopulations.
Three groups of subjects are presented: CD and non-CD as in Figs 2 and 4–6, as well as potential CD. Potential CD subjects had CD-associated HLA tissue types and positive anti-TG2 in serum, but no crypt hyperplasia or villous atrophy (Marsh grade 0 or 1). TCRαβ+ TCRγδ- IELs are shown in Panel A, and TCRαβ- TCRγδ+ IELs in Panel B. n = 10 (non-CD controls), 4 (potential CD) and 11 (CD).

