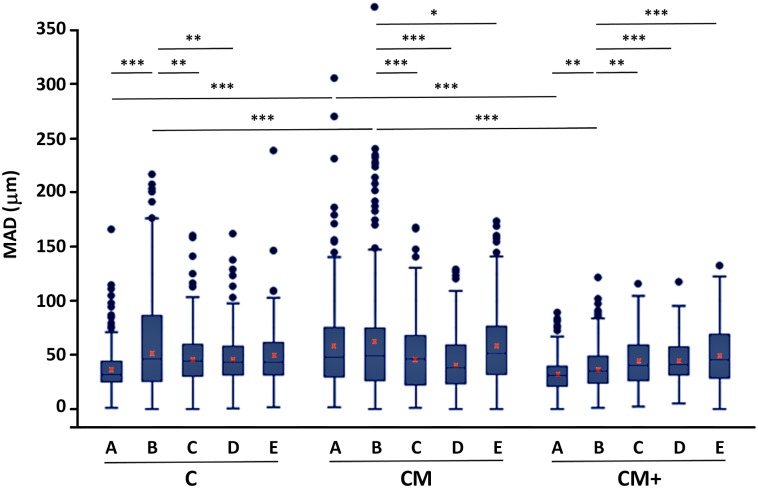
Fig 7. Quantification of cell migration.
Box and whiskers plot of the mean accumulated distance (MAD), after 12 hours of migration hydrogel types C, CM and CM+, with no added chemo-attracting substance (A), using serum containing medium, (B) or after conjugation with integrin-blocking antibodies: 20% FBS + Anti-β1 (C), 20% FBS + Anti-β3 (D) and 20% FBS + Anti-β1+β3 (E). Red crosses mark the location of the mean value for each treatment and hydrogel, calculated as the pondered average of the mean value of the three replicas of each experiment. *, **,*** Indicates statistically significant difference with p<0.05, p<0.01 and p<0.001, respectively.

