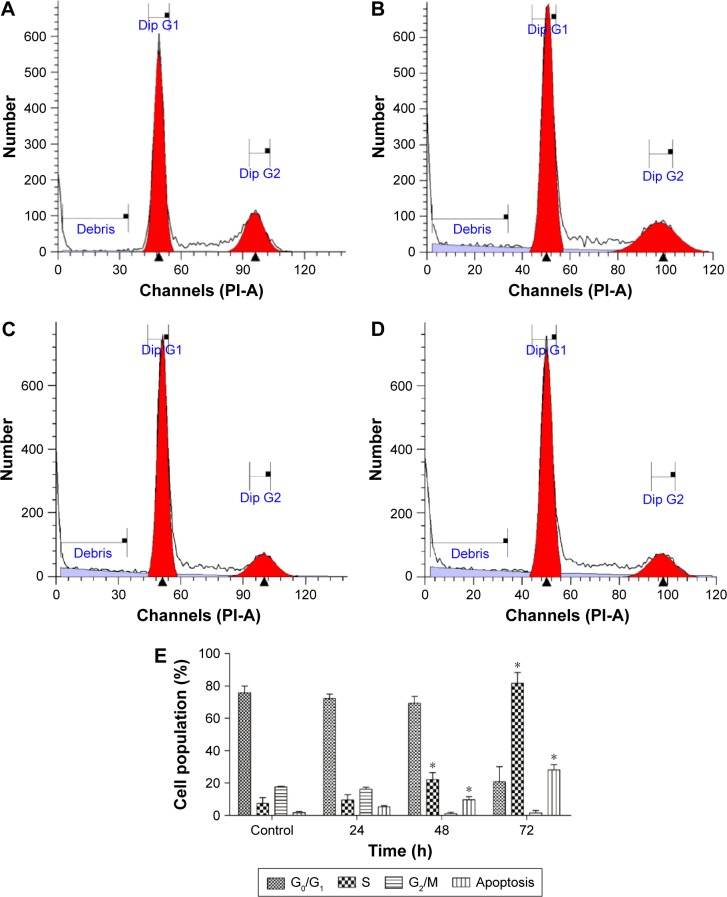
Figure 11.
Flow cytometric analysis of cell cycle distribution in MCF7 cell line.
Notes: Cells were treated with IC50 of 8-hydroxy-ar-turmerone for 24, 48 and 72 h. The histogram is represented as: (A) control; (B) 24 h; (C) 48 h and (D) 74 h. Cells were cultured in RPMI 1640 (25 mL flask) media maintained at 37°C and 5% CO2. (E) Data represents the significant elevation of the cells numbers in S phase after 48 and 72 hours of treatment. Data are shown as mean ± SD (n=3). *Significant difference (P<0.05) compared with the control.
Abbreviations: IC50, half maximal inhibitory concentration; PI-A, propidium iodide A channel.

