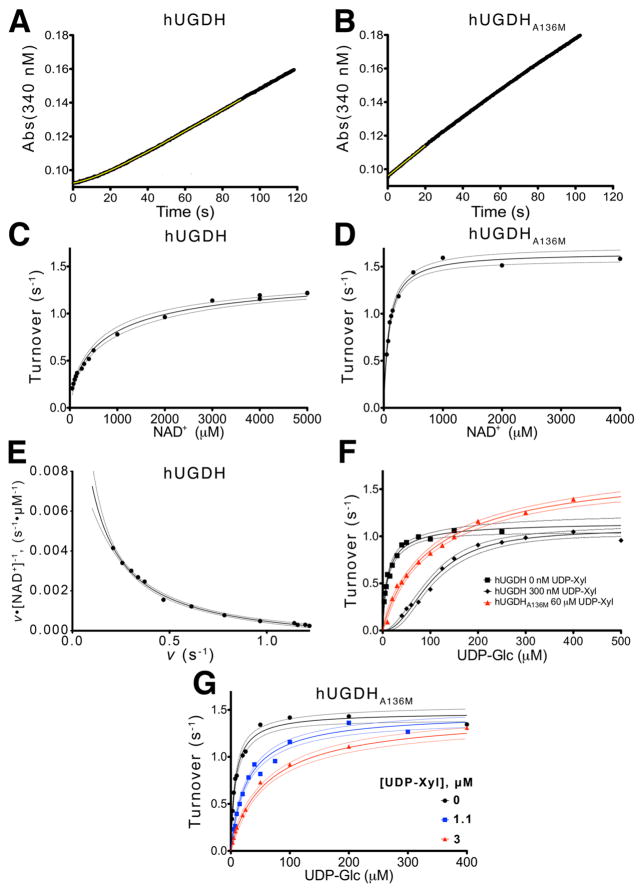
Figure 6. The A136M substitution disrupts hysteresis and cooperativity.
(A) Stopped-flow analysis of hysteresis in the hUDGH progress curve under saturating concentrations of NAD+ (5mM) and UDP- Glc (0.5mM). The data points (black line) are fit (yellow line) to eq. 1 as described in the Materials and Methods. (B) The hUDGHA136M progress curve was analyzed as in panel A shows no lag, and is fit to linear equation (yellow line) to obtain the initial steady state velocity. The yellow line represents a linear fit for the first 20 seconds of the reaction. (C and D) The NAD+ saturation curves for hUGDH and hUGDHA136M, respectively, fit to eq. 3. The rates are normalized to turnover (nM NADH per nM enzyme per second). Dashed lines represent the 95% confidence interval of the fit in all panels. (E) An Eadie-Hofstee plot of the hUGDH NAD+ saturation data in panel C is concave up (negative cooperativity), and was fit to eq. 3 to determine the K0 and Klim values in Table 3. Velocity (v) was normalized to turnover (s−1) as in panels C & D. (F) hUGDH UDP-glucose saturation curves (black lines) with 0 μM (squares) and 3 μM (diamonds) UDP-xylose were globally fit to eq. 4 to determine Ki and the Hill coefficient. For comparison, data from a hUGDHA136M UDP-glucose saturation curve with 60 μM UDP-Xyl (red triangles) is plotted. (G) hUGDHA136M UDP-glucose saturation curves with 0 μM (black circles), 11 μM (blue squares) and 30 μM (red triangles) UDP-xylose were globally fit to eq. 6 to determine Ki.

