Figure 1.

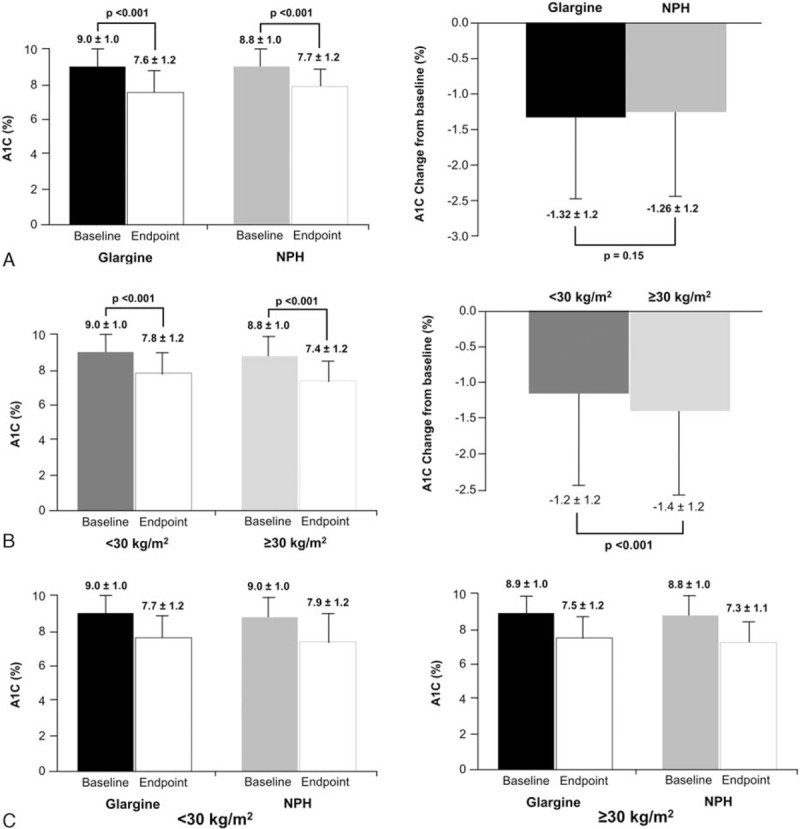
A1C levels at baseline and endpoint by treatment group (A), BMI group (B), and treatment/BMI (C). A1C, glycosylated hemoglobin; BMI, body mass index.

A1C levels at baseline and endpoint by treatment group (A), BMI group (B), and treatment/BMI (C). A1C, glycosylated hemoglobin; BMI, body mass index.